Citibank 2012 Annual Report Download - page 207
Download and view the complete annual report
Please find page 207 of the 2012 Citibank annual report below. You can navigate through the pages in the report by either clicking on the pages listed below, or by using the keyword search tool below to find specific information within the annual report.-
 1
1 -
2
-
3
-
4
-
5
-
6
-
7
-
8
-
9
-
10
-
11
-
12
-
13
-
14
-
15
-
16
-
17
-
18
-
19
-
20
-
21
-
22
-
23
-
24
-
25
-
26
-
27
-
28
-
29
-
30
-
31
-
32
-
33
-
34
-
35
-
36
-
37
-
38
-
39
-
40
-
41
-
42
-
43
-
44
-
45
-
46
-
47
-
48
-
49
-
50
-
51
-
52
-
53
-
54
-
55
-
56
-
57
-
58
-
59
-
60
-
61
-
62
-
63
-
64
-
65
-
66
-
67
-
68
-
69
-
70
-
71
-
72
-
73
-
74
-
75
-
76
-
77
-
78
-
79
-
80
-
81
-
82
-
83
-
84
-
85
-
86
-
87
-
88
-
89
-
90
-
91
-
92
-
93
-
94
-
95
-
96
-
97
-
98
-
99
-
100
-
101
-
102
-
103
-
104
-
105
-
106
-
107
-
108
-
109
-
110
-
111
-
112
-
113
-
114
-
115
-
116
-
117
-
118
-
119
-
120
-
121
-
122
-
123
-
124
-
125
-
126
-
127
-
128
-
129
-
130
-
131
-
132
-
133
-
134
-
135
-
136
-
137
-
138
-
139
-
140
-
141
-
142
-
143
-
144
-
145
-
146
-
147
-
148
-
149
-
150
-
151
-
152
-
153
-
154
-
155
-
156
-
157
-
158
-
159
-
160
-
161
-
162
-
163
-
164
-
165
-
166
-
167
-
168
-
169
-
170
-
171
-
172
-
173
-
174
-
175
-
176
-
177
-
178
-
179
-
180
-
181
-
182
-
183
-
184
-
185
-
186
-
187
-
188
-
189
-
190
-
191
-
192
-
193
-
194
-
195
-
196
-
 197
197 -
 198
198 -
 199
199 -
 200
200 -
 201
201 -
 202
202 -
 203
203 -
 204
204 -
 205
205 -
 206
206 -
 207
207 -
 208
208 -
 209
209 -
 210
210 -
 211
211 -
 212
212 -
 213
213 -
 214
214 -
 215
215 -
 216
216 -
 217
217 -
218
-
219
-
220
-
221
-
222
-
223
-
224
-
225
-
226
-
227
-
228
-
229
-
230
-
231
-
232
-
233
-
234
-
235
-
236
-
237
-
238
-
239
-
240
-
241
-
242
-
243
-
244
-
245
-
246
-
247
-
248
-
249
-
250
-
251
-
252
-
253
-
254
-
255
-
256
-
257
-
258
-
259
-
260
-
261
-
262
-
263
-
264
-
265
-
266
-
267
-
268
-
269
-
270
-
271
-
272
-
273
-
274
-
275
-
276
-
277
-
278
-
279
-
280
-
281
-
282
-
283
-
284
-
285
-
286
-
287
-
288
-
289
-
290
-
291
-
292
-
293
-
294
-
295
-
296
-
297
-
298
-
299
-
300
-
301
-
302
-
303
-
304
-
305
-
306
-
307
-
308
-
309
-
310
-
311
-
312
-
313
-
314
-
315
-
316
-
317
-
318
-
319
-
320
-
321
-
322
-
323
-
324
 |
 |

185
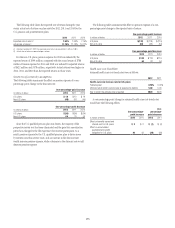
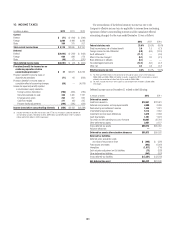
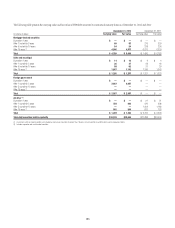
The Company has no valuation allowance on its deferred tax assets
(DTAs) at December 31, 2012 and December 31, 2011.
In billions of dollars
Jurisdiction/component
DTA balance
December 31, 2012
DTA balance
December 31, 2011
U.S. federal (1)
Consolidated tax return net
operating losses (NOLs) $ — $ —
Consolidated tax return
foreign tax credits (FTCs) 22.0 15.8
Consolidated tax return
general business credits (GBCs) 2.6 2.1
Future tax deductions and credits 22.0 23.0
Other (2) 0.9 1.4
Total U.S. federal $47.5 $42.3
State and local
New York NOLs $ 1.3 $ 1.3
Other state NOLs 0.6 0.7
Future tax deductions 2.6 2.2
Total state and local $ 4.5 $ 4.2
Foreign
APB 23 subsidiary NOLs $ 0.2 $ 0.5
Non-APB 23 subsidiary NOLs 1.2 1.8
Future tax deductions 1.9 2.7
Total foreign $ 3.3 $ 5.0
Total $55.3 $51.5
(1) Included in the net U.S. federal DTAs of $47.5 billion are deferred tax liabilities of $2 billion that will
reverse in the relevant carry-forward period and may be used to support the DTAs.
(2) Includes $0.8 billion and $1.2 billion for 2012 and 2011, respectively, of subsidiary tax
carry-forwards related to companies that are expected to be utilized separate from Citigroup’s
consolidated tax carry-forwards.
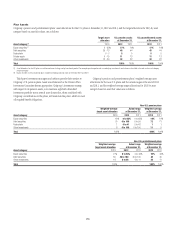
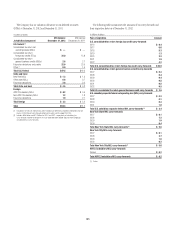
The following table summarizes the amounts of tax carry-forwards and
their expiration dates as of December 31, 2012:
In billions of dollars
Year of expiration Amount
U.S. consolidated tax return foreign tax credit carry-forwards
2016 $ 0.4
2017 6.6
2018 5.3
2019 1.3
2020 2.3
2021 1.9
2022 4.2
Total U.S. consolidated tax return foreign tax credit carry-forwards $22.0
U.S. consolidated tax return general business credit carry-forwards
2027 $ 0.3
2028 0.4
2029 0.4
2030 0.5
2031 0.5
2032 0.5
Total U.S. consolidated tax return general business credit carry-forwards $ 2.6
U.S. subsidiary separate federal net operating loss (NOL) carry-forwards
2027 $ 0.2
2028 0.1
2030 0.3
2031 1.8
Total U.S. subsidiary separate federal NOL carry-forwards (1) $ 2.4
New York State NOL carry-forwards
2027 $ 0.1
2028 7.2
2029 1.9
2030 0.4
Total New York State NOL carry-forwards (1) $ 9.6
New York City NOL carry-forwards
2027 $ 0.1
2028 3.7
2029 1.6
2030 0.2
Total New York City NOL carry-forwards (1) $ 5.6
APB 23 subsidiary NOL carry-forwards
Various $ 0.2
Total APB 23 subsidiary NOL carry-forwards $ 0.2
(1) Pretax.