Citibank 2012 Annual Report Download - page 119
Download and view the complete annual report
Please find page 119 of the 2012 Citibank annual report below. You can navigate through the pages in the report by either clicking on the pages listed below, or by using the keyword search tool below to find specific information within the annual report.-
 1
1 -
2
-
3
-
4
-
5
-
6
-
7
-
8
-
9
-
10
-
11
-
12
-
13
-
14
-
15
-
16
-
17
-
18
-
19
-
20
-
21
-
22
-
23
-
24
-
25
-
26
-
27
-
28
-
29
-
30
-
31
-
32
-
33
-
34
-
35
-
36
-
37
-
38
-
39
-
40
-
41
-
42
-
43
-
44
-
45
-
46
-
47
-
48
-
49
-
50
-
51
-
52
-
53
-
54
-
55
-
56
-
57
-
58
-
59
-
60
-
61
-
62
-
63
-
64
-
65
-
66
-
67
-
68
-
69
-
70
-
71
-
72
-
73
-
74
-
75
-
76
-
77
-
78
-
79
-
80
-
81
-
82
-
83
-
84
-
85
-
86
-
87
-
88
-
89
-
90
-
91
-
92
-
93
-
94
-
95
-
96
-
97
-
98
-
99
-
100
-
101
-
102
-
103
-
104
-
105
-
106
-
107
-
108
-
 109
109 -
 110
110 -
 111
111 -
 112
112 -
 113
113 -
 114
114 -
 115
115 -
 116
116 -
 117
117 -
 118
118 -
 119
119 -
 120
120 -
 121
121 -
 122
122 -
 123
123 -
 124
124 -
 125
125 -
 126
126 -
 127
127 -
 128
128 -
 129
129 -
130
-
131
-
132
-
133
-
134
-
135
-
136
-
137
-
138
-
139
-
140
-
141
-
142
-
143
-
144
-
145
-
146
-
147
-
148
-
149
-
150
-
151
-
152
-
153
-
154
-
155
-
156
-
157
-
158
-
159
-
160
-
161
-
162
-
163
-
164
-
165
-
166
-
167
-
168
-
169
-
170
-
171
-
172
-
173
-
174
-
175
-
176
-
177
-
178
-
179
-
180
-
181
-
182
-
183
-
184
-
185
-
186
-
187
-
188
-
189
-
190
-
191
-
192
-
193
-
194
-
195
-
196
-
197
-
198
-
199
-
200
-
201
-
202
-
203
-
204
-
205
-
206
-
207
-
208
-
209
-
210
-
211
-
212
-
213
-
214
-
215
-
216
-
217
-
218
-
219
-
220
-
221
-
222
-
223
-
224
-
225
-
226
-
227
-
228
-
229
-
230
-
231
-
232
-
233
-
234
-
235
-
236
-
237
-
238
-
239
-
240
-
241
-
242
-
243
-
244
-
245
-
246
-
247
-
248
-
249
-
250
-
251
-
252
-
253
-
254
-
255
-
256
-
257
-
258
-
259
-
260
-
261
-
262
-
263
-
264
-
265
-
266
-
267
-
268
-
269
-
270
-
271
-
272
-
273
-
274
-
275
-
276
-
277
-
278
-
279
-
280
-
281
-
282
-
283
-
284
-
285
-
286
-
287
-
288
-
289
-
290
-
291
-
292
-
293
-
294
-
295
-
296
-
297
-
298
-
299
-
300
-
301
-
302
-
303
-
304
-
305
-
306
-
307
-
308
-
309
-
310
-
311
-
312
-
313
-
314
-
315
-
316
-
317
-
318
-
319
-
320
-
321
-
322
-
323
-
324
 |
 |
97
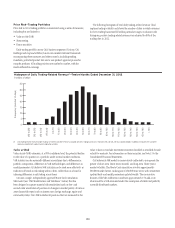
North America Cards
Overview
Citi’s North America cards portfolio primarily consists of its Citi-branded
cards and Citi retail services portfolios in Citicorp. As of December 31, 2012,
the Citicorp Citi-branded cards portfolio totaled approximately $73 billion,
while the Citi retail services portfolio was approximately $39 billion.
See Note 16 to the Consolidated Financial Statements for additional
information on Citi’s North America cards modifications.
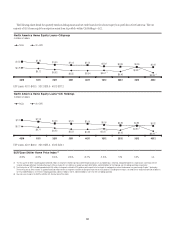
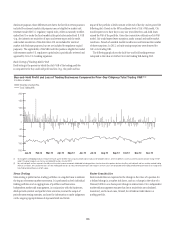
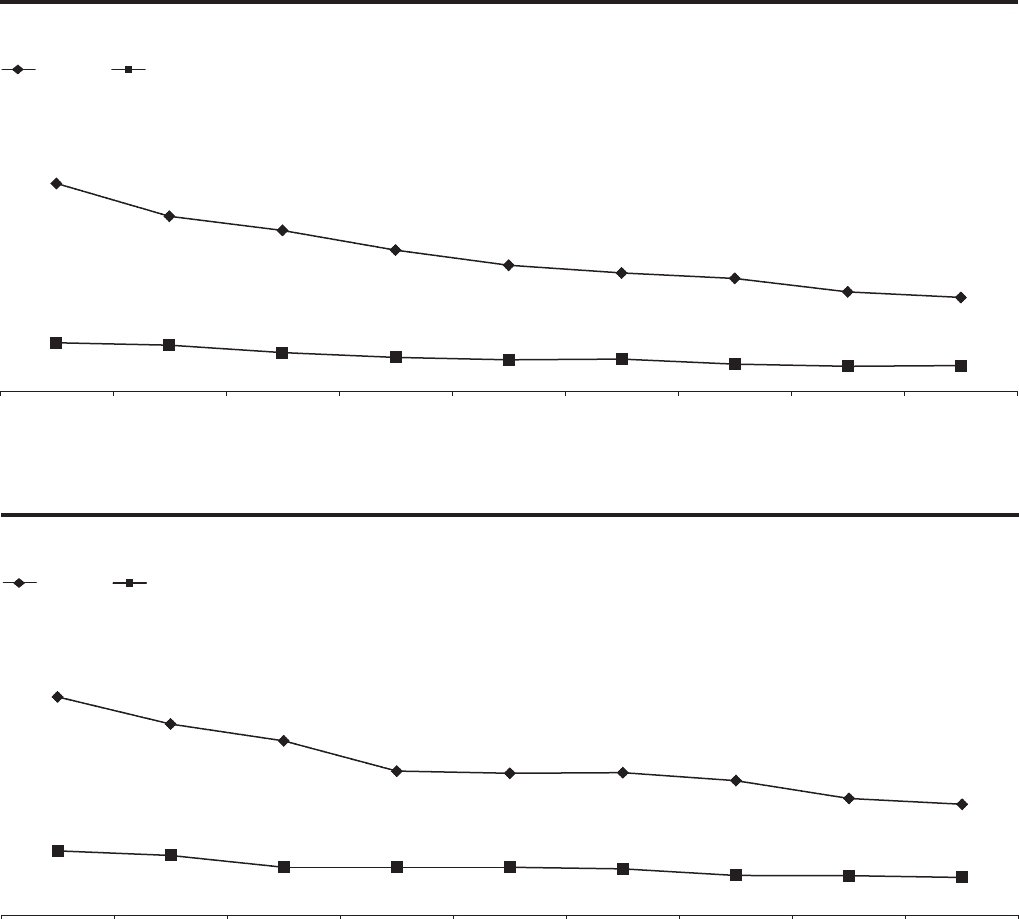
North America Cards Quarterly Credit Trends—Delinquencies and Net
Credit Losses
The following charts detail the quarterly trends in delinquencies and net
credit losses for Citigroup’s North America Citi-branded cards and Citi retail
services portfolios in Citicorp. Assuming no significant downturn in the
economic environment, Citi believes the improvement in credit trends in its
card portfolios had largely stabilized as of the end of 2012, and delinquencies
and net credit losses in these portfolios could begin to increase in line with
portfolio growth.
4Q10 1Q11 2Q11 3Q11 4Q11 1Q12 2Q12 4Q123Q12
NCLs 90+DPD
Citi-Branded Cards—Citigroup
In billions of dollars
EOP Loans: 4Q11-$77.2 3Q12-$72.2 4Q12-$72.9
8.67%
5.89%
7.30% 6.71%
5.26% 4.94% 4.71%
3.92%
1.08%
4.15%
1.05%
1.14%
1.42%
1.93% 1.62% 1.32% 1.35%2.03%
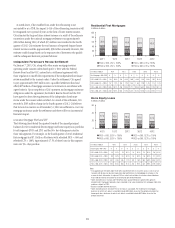
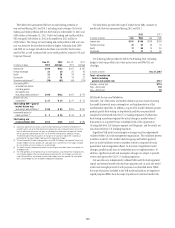
4Q10 1Q11 2Q11 3Q11 4Q11 1Q12 2Q12 4Q123Q12
NCLs 90+DPD
10.90%
7.19%
9.54% 8.70%
7.08% 7.11% 6.71%
5.53%
1.87%
5.82%
1.96%1.97%
2.38%
2.97% 2.38% 2.38% 2.30%
3.20%
Citi Retail Services—Citigroup
In billions of dollars
EOP Loans: 4Q11-$39.9 3Q12-$36.6 4Q12-$38.6