Citibank 2012 Annual Report Download - page 288
Download and view the complete annual report
Please find page 288 of the 2012 Citibank annual report below. You can navigate through the pages in the report by either clicking on the pages listed below, or by using the keyword search tool below to find specific information within the annual report.-
 1
1 -
2
-
3
-
4
-
5
-
6
-
7
-
8
-
9
-
10
-
11
-
12
-
13
-
14
-
15
-
16
-
17
-
18
-
19
-
20
-
21
-
22
-
23
-
24
-
25
-
26
-
27
-
28
-
29
-
30
-
31
-
32
-
33
-
34
-
35
-
36
-
37
-
38
-
39
-
40
-
41
-
42
-
43
-
44
-
45
-
46
-
47
-
48
-
49
-
50
-
51
-
52
-
53
-
54
-
55
-
56
-
57
-
58
-
59
-
60
-
61
-
62
-
63
-
64
-
65
-
66
-
67
-
68
-
69
-
70
-
71
-
72
-
73
-
74
-
75
-
76
-
77
-
78
-
79
-
80
-
81
-
82
-
83
-
84
-
85
-
86
-
87
-
88
-
89
-
90
-
91
-
92
-
93
-
94
-
95
-
96
-
97
-
98
-
99
-
100
-
101
-
102
-
103
-
104
-
105
-
106
-
107
-
108
-
109
-
110
-
111
-
112
-
113
-
114
-
115
-
116
-
117
-
118
-
119
-
120
-
121
-
122
-
123
-
124
-
125
-
126
-
127
-
128
-
129
-
130
-
131
-
132
-
133
-
134
-
135
-
136
-
137
-
138
-
139
-
140
-
141
-
142
-
143
-
144
-
145
-
146
-
147
-
148
-
149
-
150
-
151
-
152
-
153
-
154
-
155
-
156
-
157
-
158
-
159
-
160
-
161
-
162
-
163
-
164
-
165
-
166
-
167
-
168
-
169
-
170
-
171
-
172
-
173
-
174
-
175
-
176
-
177
-
178
-
179
-
180
-
181
-
182
-
183
-
184
-
185
-
186
-
187
-
188
-
189
-
190
-
191
-
192
-
193
-
194
-
195
-
196
-
197
-
198
-
199
-
200
-
201
-
202
-
203
-
204
-
205
-
206
-
207
-
208
-
209
-
210
-
211
-
212
-
213
-
214
-
215
-
216
-
217
-
218
-
219
-
220
-
221
-
222
-
223
-
224
-
225
-
226
-
227
-
228
-
229
-
230
-
231
-
232
-
233
-
234
-
235
-
236
-
237
-
238
-
239
-
240
-
241
-
242
-
243
-
244
-
245
-
246
-
247
-
248
-
249
-
250
-
251
-
252
-
253
-
254
-
255
-
256
-
257
-
258
-
259
-
260
-
261
-
262
-
263
-
264
-
265
-
266
-
267
-
268
-
269
-
270
-
271
-
272
-
273
-
274
-
275
-
276
-
277
-
 278
278 -
 279
279 -
 280
280 -
 281
281 -
 282
282 -
 283
283 -
 284
284 -
 285
285 -
 286
286 -
 287
287 -
 288
288 -
 289
289 -
 290
290 -
 291
291 -
 292
292 -
 293
293 -
 294
294 -
 295
295 -
 296
296 -
 297
297 -
 298
298 -
299
-
300
-
301
-
302
-
303
-
304
-
305
-
306
-
307
-
308
-
309
-
310
-
311
-
312
-
313
-
314
-
315
-
316
-
317
-
318
-
319
-
320
-
321
-
322
-
323
-
324
 |
 |

266
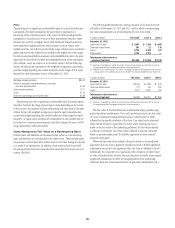
Price
The price input is a significant unobservable input for certain fixed income
instruments. For these instruments, the price input is expressed as a
percentage of the notional amount, with a price of $100 meaning that the
instrument is valued at par. For most of these instruments, the price varies
between zero to $100, or slightly above $100. Relatively illiquid assets that
have experienced significant losses since issuance, such as certain asset-
backed securities, are at the lower end of the range, whereas most investment
grade corporate bonds will fall in the middle to the higher end of the range.
For certain structured debt instruments with embedded derivatives, the price
input may be above $100 to reflect the embedded features of the instrument
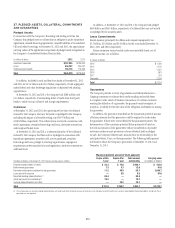
(for example, a step-up coupon or a conversion option). For the following
classes of fixed income instruments, the weighted average price input below
provides insight regarding the central tendencies of the ranges of this input
reported for each instrument class as of December 31, 2012:
Mortgage-backed securities $86.02
State and municipal, foreign government, corporate,
and other debt securities 90.95
Asset-backed securities 79.71
Loans 91.25
Short-term borrowings and long-term debt 93.38
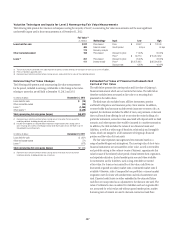
The price input is also a significant unobservable input for certain equity
securities; however, the range of price inputs varies depending on the nature
of the position, the number of shares outstanding and other factors. Because
of these factors, the weighted average price input for equity securities does
not provide insight regarding the central tendencies of the ranges for equity
securities, as equity prices are generally independent of one another and are
not subject to a common measurement scale (for example, the zero to $100
range applicable to debt instruments).
Items Measured at Fair Value on a Nonrecurring Basis
Certain assets and liabilities are measured at fair value on a nonrecurring
basis and therefore are not included in the tables above. These include assets
measured at cost that have been written down to fair value during the periods
as a result of an impairment. In addition, these assets include loans held-
for-sale and other real estate owned that are measured at the lower of cost or
market (LOCOM).
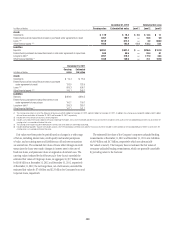
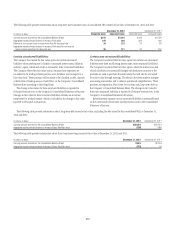
The following table presents the carrying amounts of all assets that were
still held as of December 31, 2012 and 2011, and for which a nonrecurring
fair value measurement was recorded during the year then ended:
In millions of dollars Fair value Level 2 Level 3
December 31, 2012
Loans held-for-sale $ 2,647 $ 1,159 $ 1,488
Other real estate owned 201 22 179
Loans (1) 5,732 5,160 572
Other assets (2) 4,725 4,725 —
Total assets at fair value on a
nonrecurring basis $13,305 $11,066 $ 2,239
(1) Represents impaired loans held for investment whose carrying amount is based on the fair value of
the underlying collateral, including primarily real-estate secured loans.
(2) Represents Citi’s remaining 35% investment in the Morgan Stanley Smith Barney joint venture whose
carrying amount is the agreed purchase price. See Note 15 to the Consolidated Financial Statements.
In millions of dollars Fair value Level 2 Level 3
December 31, 2011
Loans held-for-sale $2,644 $1,668 $ 976
Other real estate owned 271 88 183
Loans (1) 3,911 3,185 726
Total assets at fair value on a
nonrecurring basis $6,826 $4,941 $1,885
(1) Represents impaired loans held for investment whose carrying amount is based on the fair value of
the underlying collateral, including primarily real-estate secured loans.
The fair value of loans-held-for-sale is determined where possible using
quoted secondary-market prices. If no such quoted price exists, the fair value
of a loan is determined using quoted prices for a similar asset or assets,
adjusted for the specific attributes of that loan. Fair value for the other real
estate owned is based on appraisals. For loans whose carrying amount is
based on the fair value of the underlying collateral, the fair values depend
on the type of collateral. Fair value of the collateral is typically estimated
based on quoted market prices if available, appraisals or other internal
valuation techniques.
Where the fair value of the related collateral is based on an unadjusted
appraised value, the loan is generally classified as Level 2. Where significant
adjustments are made to the appraised value, the loan is classified as Level 3.
Additionally, for corporate loans, appraisals of the collateral are often based
on sales of similar assets; however, because the prices of similar assets require
significant adjustments to reflect the unique features of the underlying
collateral, these fair value measurements are generally classified as Level 3.