Citibank 2012 Annual Report Download - page 289
Download and view the complete annual report
Please find page 289 of the 2012 Citibank annual report below. You can navigate through the pages in the report by either clicking on the pages listed below, or by using the keyword search tool below to find specific information within the annual report.-
 1
1 -
2
-
3
-
4
-
5
-
6
-
7
-
8
-
9
-
10
-
11
-
12
-
13
-
14
-
15
-
16
-
17
-
18
-
19
-
20
-
21
-
22
-
23
-
24
-
25
-
26
-
27
-
28
-
29
-
30
-
31
-
32
-
33
-
34
-
35
-
36
-
37
-
38
-
39
-
40
-
41
-
42
-
43
-
44
-
45
-
46
-
47
-
48
-
49
-
50
-
51
-
52
-
53
-
54
-
55
-
56
-
57
-
58
-
59
-
60
-
61
-
62
-
63
-
64
-
65
-
66
-
67
-
68
-
69
-
70
-
71
-
72
-
73
-
74
-
75
-
76
-
77
-
78
-
79
-
80
-
81
-
82
-
83
-
84
-
85
-
86
-
87
-
88
-
89
-
90
-
91
-
92
-
93
-
94
-
95
-
96
-
97
-
98
-
99
-
100
-
101
-
102
-
103
-
104
-
105
-
106
-
107
-
108
-
109
-
110
-
111
-
112
-
113
-
114
-
115
-
116
-
117
-
118
-
119
-
120
-
121
-
122
-
123
-
124
-
125
-
126
-
127
-
128
-
129
-
130
-
131
-
132
-
133
-
134
-
135
-
136
-
137
-
138
-
139
-
140
-
141
-
142
-
143
-
144
-
145
-
146
-
147
-
148
-
149
-
150
-
151
-
152
-
153
-
154
-
155
-
156
-
157
-
158
-
159
-
160
-
161
-
162
-
163
-
164
-
165
-
166
-
167
-
168
-
169
-
170
-
171
-
172
-
173
-
174
-
175
-
176
-
177
-
178
-
179
-
180
-
181
-
182
-
183
-
184
-
185
-
186
-
187
-
188
-
189
-
190
-
191
-
192
-
193
-
194
-
195
-
196
-
197
-
198
-
199
-
200
-
201
-
202
-
203
-
204
-
205
-
206
-
207
-
208
-
209
-
210
-
211
-
212
-
213
-
214
-
215
-
216
-
217
-
218
-
219
-
220
-
221
-
222
-
223
-
224
-
225
-
226
-
227
-
228
-
229
-
230
-
231
-
232
-
233
-
234
-
235
-
236
-
237
-
238
-
239
-
240
-
241
-
242
-
243
-
244
-
245
-
246
-
247
-
248
-
249
-
250
-
251
-
252
-
253
-
254
-
255
-
256
-
257
-
258
-
259
-
260
-
261
-
262
-
263
-
264
-
265
-
266
-
267
-
268
-
269
-
270
-
271
-
272
-
273
-
274
-
275
-
276
-
277
-
278
-
 279
279 -
 280
280 -
 281
281 -
 282
282 -
 283
283 -
 284
284 -
 285
285 -
 286
286 -
 287
287 -
 288
288 -
 289
289 -
 290
290 -
 291
291 -
 292
292 -
 293
293 -
 294
294 -
 295
295 -
 296
296 -
 297
297 -
 298
298 -
 299
299 -
300
-
301
-
302
-
303
-
304
-
305
-
306
-
307
-
308
-
309
-
310
-
311
-
312
-
313
-
314
-
315
-
316
-
317
-
318
-
319
-
320
-
321
-
322
-
323
-
324
 |
 |

267
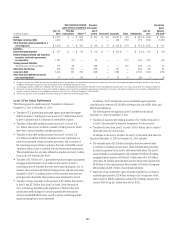
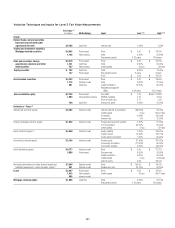
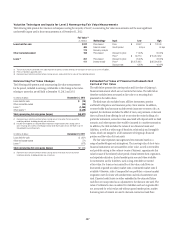
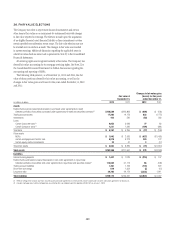
Valuation Techniques and Inputs for Level 3 Nonrecurring Fair Value Measurements
The following table presents the valuation techniques covering the majority of Level 3 nonrecurring fair value measurements and the most significant
unobservable inputs used in those measurements as of December 31, 2012:
Fair Value (1)
(in millions) Methodology Input Low High
Loans held-for-sale $747 Price-based Price $ 63.42 $ 100.00
485 External model Credit spread 40 bps 40 bps
174 Recovery analysis
Other real estate owned 165 Price-based Discount to price 11.00% 50.00%
Price (2) $ 39,774 $15,457,452
Loans (3) 351 Price-based Discount to price 25.00% 34.00%
111 Internal model Price (2) $6,272,242 $86,200,000
Discount rate 6.00% 16.49%
(1) The fair value amounts presented in this table represent the primary valuation technique or techniques for each class of assets or liabilities.
(2) Prices are based on appraised values.
(3) Represents loans held for investment whose carrying amounts are based on the fair value of the underlying collateral.
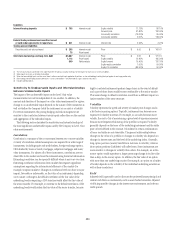
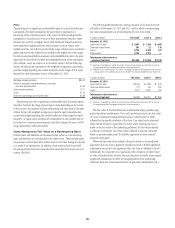
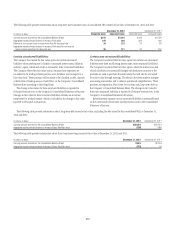
Nonrecurring Fair Value Changes
The following table presents total nonrecurring fair value measurements
for the period, included in earnings, attributable to the change in fair value
relating to assets that are still held at December 31, 2012 and 2011:
In millions of dollars December 31, 2012
Loans held-for-sale $ (19)
Other real estate owned (29)
Loans (1) (1,489)
Other assets (2) (3,340)
Total nonrecurring fair value gains (losses) $(4,877)
(1) Represents loans held for investment whose carrying amount is based on the fair value of the
underlying collateral, including primarily real-estate loans.
(2) Includes the recognition of a $3,340 million impairment charge related to the carrying value of
Citi's remaining 35% interest in the Morgan Stanley Smith Barney joint venture. See Note 15 to the
Consolidated Financial Statements.
In millions of dollars December 31, 2011
Loans held-for-sale $ (201)
Other real estate owned (71)
Loans (1) (973)
Total nonrecurring fair value gains (losses) $(1,245)
(1) Represents loans held for investment whose carrying amount is based on the fair value of the
underlying collateral, including primarily real-estate loans.
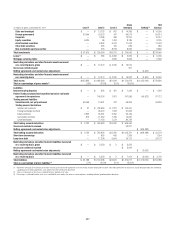
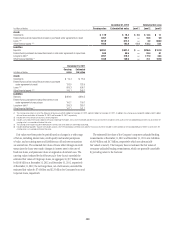
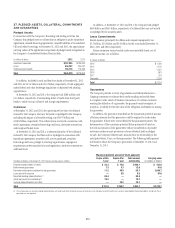
Estimated Fair Value of Financial Instruments Not
Carried at Fair Value
The table below presents the carrying value and fair value of Citigroup’s
financial instruments which are not carried at fair value. The table below
therefore excludes items measured at fair value on a recurring basis
presented in the tables above.
The disclosure also excludes leases, affiliate investments, pension
and benefit obligations and insurance policy claim reserves. In addition,
contract-holder fund amounts exclude certain insurance contracts. Also, as
required, the disclosure excludes the effect of taxes, any premium or discount
that could result from offering for sale at one time the entire holdings of a
particular instrument, excess fair value associated with deposits with no fixed
maturity, and other expenses that would be incurred in a market transaction.
In addition, the table excludes the values of non-financial assets and
liabilities, as well as a wide range of franchise, relationship and intangible
values, which are integral to a full assessment of Citigroup’s financial
position and the value of its net assets.
The fair value represents management’s best estimates based on a
range of methodologies and assumptions. The carrying value of short-term
financial instruments not accounted for at fair value, as well as receivables
and payables arising in the ordinary course of business, approximates fair
value because of the relatively short period of time between their origination
and expected realization. Quoted market prices are used when available
for investments and for liabilities, such as long-term debt not carried
at fair value. For loans not accounted for at fair value, cash flows are
discounted at quoted secondary market rates or estimated market rates if
available. Otherwise, sales of comparable loan portfolios or current market
origination rates for loans with similar terms and risk characteristics are
used. Expected credit losses are either embedded in the estimated future
cash flows or incorporated as an adjustment to the discount rate used. The
value of collateral is also considered. For liabilities such as long-term debt
not accounted for at fair value and without quoted market prices, market
borrowing rates of interest are used to discount contractual cash flows.