Citibank 2012 Annual Report Download - page 165
Download and view the complete annual report
Please find page 165 of the 2012 Citibank annual report below. You can navigate through the pages in the report by either clicking on the pages listed below, or by using the keyword search tool below to find specific information within the annual report.-
 1
1 -
2
-
3
-
4
-
5
-
6
-
7
-
8
-
9
-
10
-
11
-
12
-
13
-
14
-
15
-
16
-
17
-
18
-
19
-
20
-
21
-
22
-
23
-
24
-
25
-
26
-
27
-
28
-
29
-
30
-
31
-
32
-
33
-
34
-
35
-
36
-
37
-
38
-
39
-
40
-
41
-
42
-
43
-
44
-
45
-
46
-
47
-
48
-
49
-
50
-
51
-
52
-
53
-
54
-
55
-
56
-
57
-
58
-
59
-
60
-
61
-
62
-
63
-
64
-
65
-
66
-
67
-
68
-
69
-
70
-
71
-
72
-
73
-
74
-
75
-
76
-
77
-
78
-
79
-
80
-
81
-
82
-
83
-
84
-
85
-
86
-
87
-
88
-
89
-
90
-
91
-
92
-
93
-
94
-
95
-
96
-
97
-
98
-
99
-
100
-
101
-
102
-
103
-
104
-
105
-
106
-
107
-
108
-
109
-
110
-
111
-
112
-
113
-
114
-
115
-
116
-
117
-
118
-
119
-
120
-
121
-
122
-
123
-
124
-
125
-
126
-
127
-
128
-
129
-
130
-
131
-
132
-
133
-
134
-
135
-
136
-
137
-
138
-
139
-
140
-
141
-
142
-
143
-
144
-
145
-
146
-
147
-
148
-
149
-
150
-
151
-
152
-
153
-
154
-
 155
155 -
 156
156 -
 157
157 -
 158
158 -
 159
159 -
 160
160 -
 161
161 -
 162
162 -
 163
163 -
 164
164 -
 165
165 -
 166
166 -
 167
167 -
 168
168 -
 169
169 -
 170
170 -
 171
171 -
 172
172 -
 173
173 -
 174
174 -
 175
175 -
176
-
177
-
178
-
179
-
180
-
181
-
182
-
183
-
184
-
185
-
186
-
187
-
188
-
189
-
190
-
191
-
192
-
193
-
194
-
195
-
196
-
197
-
198
-
199
-
200
-
201
-
202
-
203
-
204
-
205
-
206
-
207
-
208
-
209
-
210
-
211
-
212
-
213
-
214
-
215
-
216
-
217
-
218
-
219
-
220
-
221
-
222
-
223
-
224
-
225
-
226
-
227
-
228
-
229
-
230
-
231
-
232
-
233
-
234
-
235
-
236
-
237
-
238
-
239
-
240
-
241
-
242
-
243
-
244
-
245
-
246
-
247
-
248
-
249
-
250
-
251
-
252
-
253
-
254
-
255
-
256
-
257
-
258
-
259
-
260
-
261
-
262
-
263
-
264
-
265
-
266
-
267
-
268
-
269
-
270
-
271
-
272
-
273
-
274
-
275
-
276
-
277
-
278
-
279
-
280
-
281
-
282
-
283
-
284
-
285
-
286
-
287
-
288
-
289
-
290
-
291
-
292
-
293
-
294
-
295
-
296
-
297
-
298
-
299
-
300
-
301
-
302
-
303
-
304
-
305
-
306
-
307
-
308
-
309
-
310
-
311
-
312
-
313
-
314
-
315
-
316
-
317
-
318
-
319
-
320
-
321
-
322
-
323
-
324
 |
 |

143
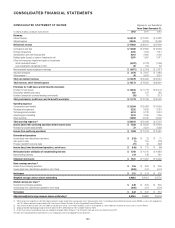
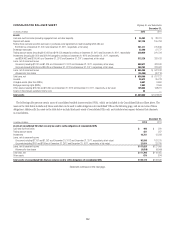
CONSOLIDATED BALANCE SHEET Citigroup Inc. and Subsidiaries
(Continued) December 31,
In millions of dollars, except shares and per share amounts 2012 2011
Liabilities
Non-interest-bearing deposits in U.S. offices $ 129,657 $ 119,437
Interest-bearing deposits in U.S. offices (including $889 and $848 as of December 31, 2012 and
December 31, 2011, respectively, at fair value) 247,716 223,851
Non-interest-bearing deposits in offices outside the U.S. 65,024 57,357
Interest-bearing deposits in offices outside the U.S. (including $558 and $478 as of December 31, 2012 and
December 31, 2011, respectively, at fair value) 488,163 465,291
Total deposits $ 930,560 $ 865,936
Federal funds purchased and securities loaned or sold under agreements to repurchase
(including $116,689 and $97,712 as of December 31, 2012 and December 31, 2011, respectively, at fair value) 211,236 198,373
Brokerage payables 57,013 56,696
Trading account liabilities 115,549 126,082
Short-term borrowings (including $818 and $1,354 as of December 31, 2012 and December 31, 2011, respectively, at fair value) 52,027 54,441
Long-term debt (including $29,764 and $24,172 as of December 31, 2012 and December 31, 2011, respectively, at fair value) 239,463 323,505
Other liabilities (including $2,910 and $3,742 as of December 31, 2012 and December 31, 2011, respectively, at fair value) 67,815 69,272
Liabilities of discontinued operations held for sale ——
Total liabilities $1,673,663 $1,694,305
Stockholders’ equity
Preferred stock ($1.00 par value; authorized shares: 30 million), issued shares: 102,038 as of
December 31, 2012 and 12,038 as of December 31, 2011, at aggregate liquidation value $ 2,562 $ 312
Common stock ($0.01 par value; authorized shares: 6 billion), issued shares: 3,043,153,204 as of
December 31, 2012 and 2,937,755,921 as of December 31, 2011 30 29
Additional paid-in capital 106,391 105,804
Retained earnings 97,809 90,520
Treasury stock, at cost: December 31, 2012—14,269,301 shares and December 31, 2011—13,877,688 shares (847) (1,071)
Accumulated other comprehensive income (loss) (16,896) (17,788)
Total Citigroup stockholders’ equity $ 189,049 $ 177,806
Noncontrolling interest 1,948 1,767
Total equity $ 190,997 $ 179,573
Total liabilities and equity $1,864,660 $1,873,878
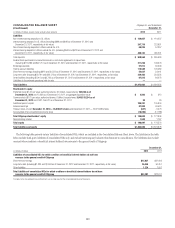
The following table presents certain liabilities of consolidated VIEs, which are included in the Consolidated Balance Sheet above. The liabilities in the table
below include third-party liabilities of consolidated VIEs only, and exclude intercompany balances that eliminate in consolidation. The liabilities also exclude
amounts where creditors or beneficial interest holders have recourse to the general credit of Citigroup.
December 31,
In millions of dollars 2012 2011
Liabilities of consolidated VIEs for which creditors or beneficial interest holders do not have
recourse to the general credit of Citigroup
Short-term borrowings $15,637 $21,009
Long-term debt (including $1,330 and $1,558 as of December 31, 2012 and December 31, 2011, respectively, at fair value) 26,346 50,451
Other liabilities 1,224 1,051
Total liabilities of consolidated VIEs for which creditors or beneficial interest holders do not have
recourse to the general credit of Citigroup $43,207 $72,511
The Notes to the Consolidated Financial Statements are an integral part of these Consolidated Financial Statements.