Citibank 2012 Annual Report Download - page 74
Download and view the complete annual report
Please find page 74 of the 2012 Citibank annual report below. You can navigate through the pages in the report by either clicking on the pages listed below, or by using the keyword search tool below to find specific information within the annual report.-
 1
1 -
2
-
3
-
4
-
5
-
6
-
7
-
8
-
9
-
10
-
11
-
12
-
13
-
14
-
15
-
16
-
17
-
18
-
19
-
20
-
21
-
22
-
23
-
24
-
25
-
26
-
27
-
28
-
29
-
30
-
31
-
32
-
33
-
34
-
35
-
36
-
37
-
38
-
39
-
40
-
41
-
42
-
43
-
44
-
45
-
46
-
47
-
48
-
49
-
50
-
51
-
52
-
53
-
54
-
55
-
56
-
57
-
58
-
59
-
60
-
61
-
62
-
63
-
 64
64 -
 65
65 -
 66
66 -
 67
67 -
 68
68 -
 69
69 -
 70
70 -
 71
71 -
 72
72 -
 73
73 -
 74
74 -
 75
75 -
 76
76 -
 77
77 -
 78
78 -
 79
79 -
 80
80 -
 81
81 -
 82
82 -
 83
83 -
 84
84 -
85
-
86
-
87
-
88
-
89
-
90
-
91
-
92
-
93
-
94
-
95
-
96
-
97
-
98
-
99
-
100
-
101
-
102
-
103
-
104
-
105
-
106
-
107
-
108
-
109
-
110
-
111
-
112
-
113
-
114
-
115
-
116
-
117
-
118
-
119
-
120
-
121
-
122
-
123
-
124
-
125
-
126
-
127
-
128
-
129
-
130
-
131
-
132
-
133
-
134
-
135
-
136
-
137
-
138
-
139
-
140
-
141
-
142
-
143
-
144
-
145
-
146
-
147
-
148
-
149
-
150
-
151
-
152
-
153
-
154
-
155
-
156
-
157
-
158
-
159
-
160
-
161
-
162
-
163
-
164
-
165
-
166
-
167
-
168
-
169
-
170
-
171
-
172
-
173
-
174
-
175
-
176
-
177
-
178
-
179
-
180
-
181
-
182
-
183
-
184
-
185
-
186
-
187
-
188
-
189
-
190
-
191
-
192
-
193
-
194
-
195
-
196
-
197
-
198
-
199
-
200
-
201
-
202
-
203
-
204
-
205
-
206
-
207
-
208
-
209
-
210
-
211
-
212
-
213
-
214
-
215
-
216
-
217
-
218
-
219
-
220
-
221
-
222
-
223
-
224
-
225
-
226
-
227
-
228
-
229
-
230
-
231
-
232
-
233
-
234
-
235
-
236
-
237
-
238
-
239
-
240
-
241
-
242
-
243
-
244
-
245
-
246
-
247
-
248
-
249
-
250
-
251
-
252
-
253
-
254
-
255
-
256
-
257
-
258
-
259
-
260
-
261
-
262
-
263
-
264
-
265
-
266
-
267
-
268
-
269
-
270
-
271
-
272
-
273
-
274
-
275
-
276
-
277
-
278
-
279
-
280
-
281
-
282
-
283
-
284
-
285
-
286
-
287
-
288
-
289
-
290
-
291
-
292
-
293
-
294
-
295
-
296
-
297
-
298
-
299
-
300
-
301
-
302
-
303
-
304
-
305
-
306
-
307
-
308
-
309
-
310
-
311
-
312
-
313
-
314
-
315
-
316
-
317
-
318
-
319
-
320
-
321
-
322
-
323
-
324
 |
 |
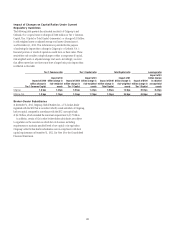
52
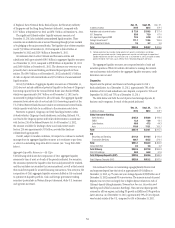
Quarter-over-quarter, end-of-period deposits decreased 1% on a reported
basis (2% when adjusted for the impact of FX translation). During the fourth
quarter of 2012, there was an expected decline in end-of-period deposits
reflecting the runoff of approximately $12 billion of episodic deposits which
came in at the end of the third quarter, as well as $10 billion primarily due to
the expiration of the TAG program on December 31, 2012. These reductions
were partially offset by deposit growth across deposit-taking businesses,
particularly Global Consumer Banking. Further, at the direction of MSSB,
Citi transferred $4.5 billion in deposits to Morgan Stanley during the fourth
quarter of 2012 in connection with the sale of Citi’s 14% interest in MSSB (see
“Citi Holdings—Brokerage and Asset Management” above), although this
decline was offset by deposit growth in the normal course of business.
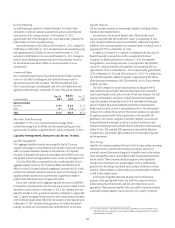
During 2012, the composition of Citi’s deposits continued to shift toward
a greater proportion of operating balances, and also toward non-interest-
bearing accounts within those operating balances. (Citi defines operating
balances as checking and savings accounts for individuals, as well as cash
management accounts for corporations. This compares to time deposits,
where rates are fixed for the term of the deposit and which have generally
lower margins). Citi believes that operating accounts are lower cost and
more reliable deposits, and exhibit “stickier,” or more retentive, behavior.
Operating balances represented 79% of Citi’s average total deposit base as
of December 31, 2012, compared to 76% at both September 30, 2012 and
December 31, 2011. Citi currently expects this shift to continue into 2013.
Deposits can be interest-bearing or non-interest-bearing. Of Citi’s $931 billion
of deposits as of December 31, 2012, $195 billion were non-interest-bearing,
compared to $177 billion at December 31, 2011. The remainder, or $736 billion,
was interest-bearing, compared to $689 billion at December 31, 2011.
Citi’s overall cost of funds on deposits decreased during 2012, despite
deposit growth throughout the year. Excluding the impact of the higher FDIC
assessment and deposit insurance, the average rate on Citi’s total deposits
was 0.64% at December 31, 2012, compared with 0.80% at December 31,
2011, and 0.86% at December 31, 2010. This translated into an approximate
$345 million reduction in quarterly interest expense over the past two
years. Consistent with prevailing interest rates, Citi experienced declining
deposit rates during 2012, notwithstanding pressure on deposit rates due to
competitive pricing in certain regions.
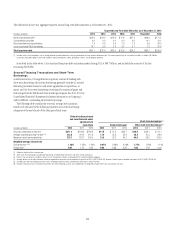
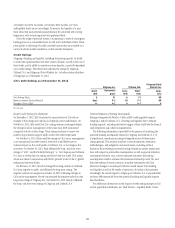
Long-Term Debt
Long-term debt (generally defined as original maturities of one year or
more) continued to represent the most significant component of Citi’s
funding for its non-bank entities, or 40% of the funding for the non-bank
entities as of December 31, 2012, compared to 45% as of December 31, 2011.
The vast majority of this funding is composed of senior term debt, along with
subordinated instruments.
Senior long-term debt includes benchmark notes and structured notes,
such as equity- and credit-linked notes. Citi’s issuance of structured notes
is generally driven by customer demand and is not a significant source of
liquidity for Citi. Structured notes frequently contain contractual features,
such as call options, which can lead to an expectation that the debt will be
redeemed earlier than one year, despite contractually scheduled maturities
greater than one year. As such, when considering the measurement of Citi’s
long-term “structural” liquidity, structured notes with these contractual
features are not included (see footnote 1 to the “Long-Term Debt Issuances
and Maturities” table below).
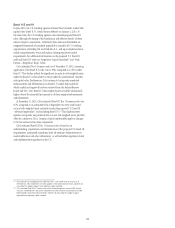
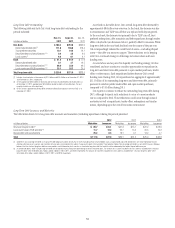
During 2012, due to the expected phase-out of Tier 1 Capital treatment
for trust preferred securities beginning as early as 2013, Citi redeemed four
series of its outstanding trust preferred securities, for an aggregate amount
of approximately $5.9 billion. Furthermore, in anticipation of this change
in qualifying regulatory capital, Citi issued approximately $2.25 billion of
preferred stock during 2012. For details on Citi’s remaining outstanding
trust preferred securities, as well as its long-term debt generally, see Note 19
to the Consolidated Financial Statements. See also “Capital Resources—
Regulatory Capital Standards” above.
Long-term debt is an important funding source for Citi’s non-bank entities
due in part to its multi-year maturity structure. The weighted average maturities
of long-term debt issued by Citigroup and its affiliates, including Citibank, N.A.,
with a remaining life greater than one year as of December 31, 2012 (excluding
trust preferred securities), was approximately 7.2 years, compared to 7.0 years at
September 30, 2012 and 7.1 years at December 31, 2011.