Citibank 2012 Annual Report Download - page 29
Download and view the complete annual report
Please find page 29 of the 2012 Citibank annual report below. You can navigate through the pages in the report by either clicking on the pages listed below, or by using the keyword search tool below to find specific information within the annual report.-
 1
1 -
2
-
3
-
4
-
5
-
6
-
7
-
8
-
9
-
10
-
11
-
12
-
13
-
14
-
15
-
16
-
17
-
18
-
 19
19 -
 20
20 -
 21
21 -
 22
22 -
 23
23 -
 24
24 -
 25
25 -
 26
26 -
 27
27 -
 28
28 -
 29
29 -
 30
30 -
 31
31 -
 32
32 -
 33
33 -
 34
34 -
 35
35 -
 36
36 -
 37
37 -
 38
38 -
 39
39 -
40
-
41
-
42
-
43
-
44
-
45
-
46
-
47
-
48
-
49
-
50
-
51
-
52
-
53
-
54
-
55
-
56
-
57
-
58
-
59
-
60
-
61
-
62
-
63
-
64
-
65
-
66
-
67
-
68
-
69
-
70
-
71
-
72
-
73
-
74
-
75
-
76
-
77
-
78
-
79
-
80
-
81
-
82
-
83
-
84
-
85
-
86
-
87
-
88
-
89
-
90
-
91
-
92
-
93
-
94
-
95
-
96
-
97
-
98
-
99
-
100
-
101
-
102
-
103
-
104
-
105
-
106
-
107
-
108
-
109
-
110
-
111
-
112
-
113
-
114
-
115
-
116
-
117
-
118
-
119
-
120
-
121
-
122
-
123
-
124
-
125
-
126
-
127
-
128
-
129
-
130
-
131
-
132
-
133
-
134
-
135
-
136
-
137
-
138
-
139
-
140
-
141
-
142
-
143
-
144
-
145
-
146
-
147
-
148
-
149
-
150
-
151
-
152
-
153
-
154
-
155
-
156
-
157
-
158
-
159
-
160
-
161
-
162
-
163
-
164
-
165
-
166
-
167
-
168
-
169
-
170
-
171
-
172
-
173
-
174
-
175
-
176
-
177
-
178
-
179
-
180
-
181
-
182
-
183
-
184
-
185
-
186
-
187
-
188
-
189
-
190
-
191
-
192
-
193
-
194
-
195
-
196
-
197
-
198
-
199
-
200
-
201
-
202
-
203
-
204
-
205
-
206
-
207
-
208
-
209
-
210
-
211
-
212
-
213
-
214
-
215
-
216
-
217
-
218
-
219
-
220
-
221
-
222
-
223
-
224
-
225
-
226
-
227
-
228
-
229
-
230
-
231
-
232
-
233
-
234
-
235
-
236
-
237
-
238
-
239
-
240
-
241
-
242
-
243
-
244
-
245
-
246
-
247
-
248
-
249
-
250
-
251
-
252
-
253
-
254
-
255
-
256
-
257
-
258
-
259
-
260
-
261
-
262
-
263
-
264
-
265
-
266
-
267
-
268
-
269
-
270
-
271
-
272
-
273
-
274
-
275
-
276
-
277
-
278
-
279
-
280
-
281
-
282
-
283
-
284
-
285
-
286
-
287
-
288
-
289
-
290
-
291
-
292
-
293
-
294
-
295
-
296
-
297
-
298
-
299
-
300
-
301
-
302
-
303
-
304
-
305
-
306
-
307
-
308
-
309
-
310
-
311
-
312
-
313
-
314
-
315
-
316
-
317
-
318
-
319
-
320
-
321
-
322
-
323
-
324
 |
 |

7
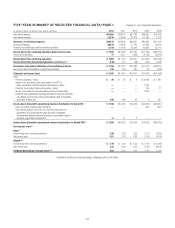
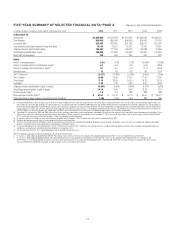
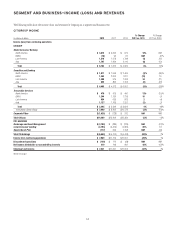
2012 Summary Results
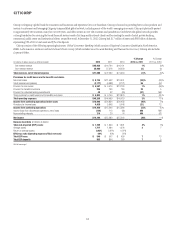
Citigroup
For 2012, Citigroup reported net income of $7.5 billion and diluted
earnings per share of $2.44, compared to $11.1 billion and $3.63 per share,
respectively, for 2011. 2012 results included several significant items:
• a negative impact from the credit valuation adjustment on derivatives
(counterparty and own-credit), net of hedges (CVA) and debt valuation
adjustment on Citi’s fair value option debt (DVA), of pretax $(2.3) billion
($(1.4) billion after-tax) as Citi’s credit spreads tightened during the
year, compared to a pretax impact of $1.8 billion ($1.1 billion after-tax)
in 2011;
• a net loss of $4.6 billion ($2.9 billion after-tax) related to the sale of
minority investments, driven by the loss from Citi’s sale of a 14% interest,
and other-than-temporary impairment on its remaining 35% interest, in
the Morgan Stanley Smith Barney (MSSB) joint venture, versus a gain of
$199 million ($128 million after-tax) in the prior year;2
• as mentioned above, $1.0 billion of repositioning charges in the fourth
quarter of 2012 ($653 million after-tax) compared to $428 million
($275 million after-tax) in the fourth quarter of 2011; and
• a $582 million tax benefit in the third quarter of 2012 related to the
resolution of certain tax audit items.
Excluding CVA/DVA, the impact of minority investments, the repositioning
charges in the fourth quarters of 2012 and 2011 and the tax benefit, net
income was $11.9 billion, or $3.86 per diluted share, in 2012, an increase of
18% compared to $10.1 billion, or $3.30 per diluted share, reported in 2011,
as higher revenues, lower core operating expenses and lower net credit losses
were partially offset by higher legal and related costs and a lower net loan
loss reserve release.3
2 As referenced above, in 2012, the sale of minority investments included a pretax loss of $4.7 billion
($2.9 billion after-tax) from the sale of a 14% interest and other-than-temporary impairment of the
carrying value of Citi’s remaining 35% interest in MSSB recorded in Citi Holdings—Brokerage and
Asset Management during the third quarter of 2012. In addition, Citi recorded a net pretax loss of
$424 million ($274 million after-tax) from the partial sale of Citi’s minority interest in Akbank T.A.S.
(Akbank) recorded in Corporate/Other during the second quarter of 2012. In the first quarter of 2012,
Citi recorded a net pretax gain on minority investments of $477 million ($308 million after-tax), which
included pretax gains of $1.1 billion and $542 million on the sales of Citi’s remaining stake in Housing
Development Finance Corporation Ltd. (HDFC) and its stake in Shanghai Pudong Development Bank
(SPDB), respectively, offset by a pretax impairment charge relating to Akbank of $1.2 billion, all within
Corporate/Other. In 2011, Citi recorded a $199 million pretax gain ($128 million after-tax) from the
partial sale of Citi’s minority interest in HDFC, recorded in Corporate/Other.
3 Presentation of Citi’s results excluding CVA/DVA, the impact of minority investments, the repositioning
charges in the fourth quarters of 2012 and 2011 and the tax benefit, as applicable, represent non-
GAAP financial measures. Citigroup believes the presentation of its results of operations excluding
these impacts provides a more meaningful depiction of the underlying fundamentals of Citi’s
businesses and enhances the comparison of results across periods.
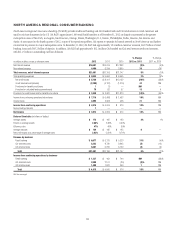
Citi’s revenues, net of interest expense, were $70.2 billion in 2012, down
10% versus the prior year. Excluding CVA/DVA and the impact of minority
investments, revenues were $77.1 billion, up 1% from 2011, as revenues in
Citicorp rose 5%, but were offset by a 40% decline in Citi Holdings revenues
compared to the prior year. Net interest revenues of $47.6 billion were 2%
lower than the prior year, largely driven by the decline in loan balances in
Local Consumer Lending in Citi Holdings as well as spread compression
in North America and Asia Regional Consumer Banking (RCB) in
Citicorp. Non-interest revenues were $22.6 billion, down 25% from the prior
year, driven by CVA/DVA and the loss on MSSB in the third quarter of 2012.
Excluding CVA/DVA and the impact of minority investments, non-interest
revenues were $29.5 billion, up 6% from the prior year, principally driven by
higher revenues in Securities and Banking and higher mortgage revenues
in North America RCB, partially offset by lower revenues in the Special Asset
Pool within Citi Holdings.
Operating Expenses
Citigroup expenses decreased 1% versus the prior year to $50.5 billion.
In 2012, in addition to the previously mentioned repositioning charges,
Citi incurred elevated legal and related costs of $2.8 billion compared to
$2.2 billion in the prior year. Excluding legal and related costs, repositioning
charges for the fourth quarters of 2012 and 2011, and the impact of foreign
exchange translation into U.S. dollars for reporting purposes (as used
throughout this report, FX translation), which lowered reported expenses by
approximately $0.9 billion in 2012 as compared to the prior year, operating
expenses declined 1% to $46.6 billion versus $47.3 billion in the prior year.
Citicorp’s expenses were $45.3 billion, up 2% from the prior year, as
efficiency savings were more than offset by higher legal and related costs and
repositioning charges. Citi Holdings expenses were down 19% year-over-year
to $5.3 billion, principally due to the continued decline in assets.