Citibank 2012 Annual Report Download - page 113
Download and view the complete annual report
Please find page 113 of the 2012 Citibank annual report below. You can navigate through the pages in the report by either clicking on the pages listed below, or by using the keyword search tool below to find specific information within the annual report.-
 1
1 -
2
-
3
-
4
-
5
-
6
-
7
-
8
-
9
-
10
-
11
-
12
-
13
-
14
-
15
-
16
-
17
-
18
-
19
-
20
-
21
-
22
-
23
-
24
-
25
-
26
-
27
-
28
-
29
-
30
-
31
-
32
-
33
-
34
-
35
-
36
-
37
-
38
-
39
-
40
-
41
-
42
-
43
-
44
-
45
-
46
-
47
-
48
-
49
-
50
-
51
-
52
-
53
-
54
-
55
-
56
-
57
-
58
-
59
-
60
-
61
-
62
-
63
-
64
-
65
-
66
-
67
-
68
-
69
-
70
-
71
-
72
-
73
-
74
-
75
-
76
-
77
-
78
-
79
-
80
-
81
-
82
-
83
-
84
-
85
-
86
-
87
-
88
-
89
-
90
-
91
-
92
-
93
-
94
-
95
-
96
-
97
-
98
-
99
-
100
-
101
-
102
-
 103
103 -
 104
104 -
 105
105 -
 106
106 -
 107
107 -
 108
108 -
 109
109 -
 110
110 -
 111
111 -
 112
112 -
 113
113 -
 114
114 -
 115
115 -
 116
116 -
 117
117 -
 118
118 -
 119
119 -
 120
120 -
 121
121 -
 122
122 -
 123
123 -
124
-
125
-
126
-
127
-
128
-
129
-
130
-
131
-
132
-
133
-
134
-
135
-
136
-
137
-
138
-
139
-
140
-
141
-
142
-
143
-
144
-
145
-
146
-
147
-
148
-
149
-
150
-
151
-
152
-
153
-
154
-
155
-
156
-
157
-
158
-
159
-
160
-
161
-
162
-
163
-
164
-
165
-
166
-
167
-
168
-
169
-
170
-
171
-
172
-
173
-
174
-
175
-
176
-
177
-
178
-
179
-
180
-
181
-
182
-
183
-
184
-
185
-
186
-
187
-
188
-
189
-
190
-
191
-
192
-
193
-
194
-
195
-
196
-
197
-
198
-
199
-
200
-
201
-
202
-
203
-
204
-
205
-
206
-
207
-
208
-
209
-
210
-
211
-
212
-
213
-
214
-
215
-
216
-
217
-
218
-
219
-
220
-
221
-
222
-
223
-
224
-
225
-
226
-
227
-
228
-
229
-
230
-
231
-
232
-
233
-
234
-
235
-
236
-
237
-
238
-
239
-
240
-
241
-
242
-
243
-
244
-
245
-
246
-
247
-
248
-
249
-
250
-
251
-
252
-
253
-
254
-
255
-
256
-
257
-
258
-
259
-
260
-
261
-
262
-
263
-
264
-
265
-
266
-
267
-
268
-
269
-
270
-
271
-
272
-
273
-
274
-
275
-
276
-
277
-
278
-
279
-
280
-
281
-
282
-
283
-
284
-
285
-
286
-
287
-
288
-
289
-
290
-
291
-
292
-
293
-
294
-
295
-
296
-
297
-
298
-
299
-
300
-
301
-
302
-
303
-
304
-
305
-
306
-
307
-
308
-
309
-
310
-
311
-
312
-
313
-
314
-
315
-
316
-
317
-
318
-
319
-
320
-
321
-
322
-
323
-
324
 |
 |
91
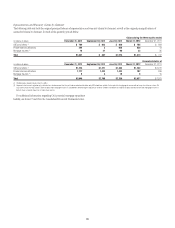
As noted above, if the modified loan under the refinancing is not
accounted for as a TDR, the impact to Citi of the refinancing concession will
be recognized over a period of years in the form of lower interest income.
Citi estimates the forgone future interest income as a result of the refinance
concessions under the national mortgage settlement was approximately
$20 million during 2012, of which $13 million was recorded in the fourth
quarter of 2012. Citi estimates the total amount of expected forgone future
interest income could be approximately $50 million annually. However, this
estimate could change based on the response rate of borrowers who qualify
and the subsequent borrower payment behavior.
Independent Foreclosure Review Settlement
On January 7, 2013, Citi, along with other major mortgage servicers
operating under consent orders dated April 13, 2011 with the Federal
Reserve Board and the OCC, entered into a settlement agreement with
those regulators to modify the requirements of the independent foreclosure
review mandated by the consent orders. Under the settlement, Citi agreed
to pay approximately $305 million into a qualified settlement fund and
offer $487 million of mortgage assistance to borrowers in accordance with
agreed criteria. Upon completion of Citi’s payment and mortgage assistance
obligations under the agreement, the Federal Reserve Board and the OCC
have agreed to deem the requirements of the independent foreclosure
review under the consent orders satisfied. As a result of the settlement, Citi
recorded a $305 million charge in the fourth quarter of 2012. Citi believes
that its loan loss reserves as of December 31, 2012 are sufficient to cover any
mortgage assistance under the settlement and there will be no incremental
financial impact.
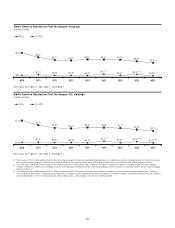
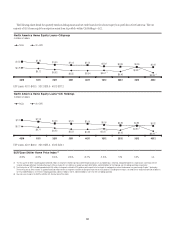
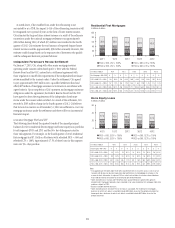
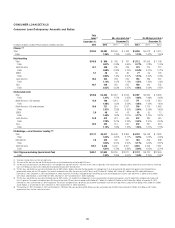
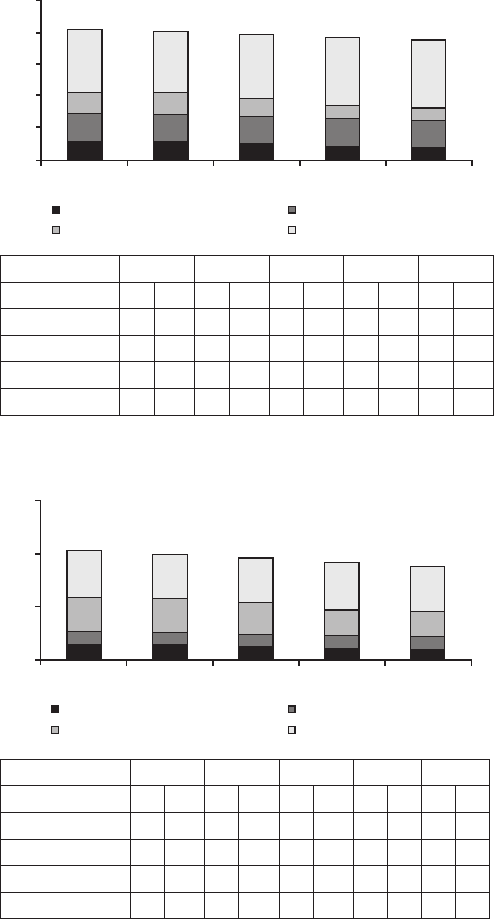
Consumer Mortgage FICO and LTV
The following charts detail the quarterly trends of the unpaid principal
balances for Citi’s residential first mortgage and home equity loan portfolios
by risk segment (FICO and LTV) and the 90+ day delinquency rates for
those risk segments. For example, in the fourth quarter of 2012, residential
first mortgages had $7.1 billion of balances with refreshed FICO < 660 and
refreshed LTV > 100%. Approximately 17.5% of these loans in this segment
were over 90+ days past due.
0
20
40
60
80
100
4Q123Q122Q121Q124Q11
11.2 11.3 9.9 7.8 7.1
17.8 16.8 17.0 17.9 17.5
13.2 13.9 11.5 8.4 7.8
39.6 38.8 40.6 42.8 43.0
Residential First Mortgages
In billions of dollars
FICO < 660, LTV > 100% FICO < 660, LTV ≤ 100%
FICO ≥ 660, LTV > 100% FICO ≥ 660, LTV ≤ 100%
In millions of dollars 4Q11 1Q12 2Q12 3Q12 4Q12
Res Mortgage—90+ DPD $ % $ % $ % $ % $ %
FICO ≥ 660, LTV ≤ 100% 143 0.4% 128 0.3% 160 0.4% 158 0.4% 167 0.4%
FICO ≥ 660, LTV > 100% 157 1.2% 164 1.2% 185 1.6% 120 1.4% 113 1.4%
FICO < 660, LTV ≤ 100% 1,916 10.7% 1,759 10.4% 1,777 10.5% 1,892 10.6% 1,776 10.1%
FICO < 660, LTV > 100% 1,842 16.5% 1,943 17.2% 1,812 18.4% 1,420 18.3% 1,245 17.5%
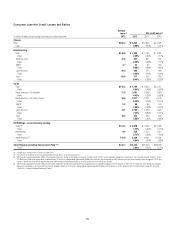
0
20
40
60
4Q123Q122Q121Q124Q11
5.4 5.4 4.8 3.9 3.7
5.0 4.6 4.6 5.0 4.8
12.8 13.0 12.0 9.7 9.4
17.9 16.6 16.9 17.9 17.3
Home Equity Loans
In billions of dollars
FICO < 660, CLTV > 100% FICO < 660, CLTV ≤ 100%
FICO ≥ 660, CLTV > 100% FICO ≥ 660, CLTV ≤ 100%
In millions of dollars 4Q11 1Q12 2Q12 3Q12 4Q12
Home Equity—90+ DPD $ % $ % $ % $ % $ %
FICO ≥ 660, CLTV ≤ 100% 18 0.1% 19 0.1% 23 0.1% 25 0.1% 26 0.1%
FICO ≥ 660, CLTV > 100% 20 0.2% 23 0.2% 25 0.2% 19 0.2% 21 0.2%
FICO < 660, CLTV ≤ 100% 381 7.6% 336 7.2% 352 7.6% 394 8.0% 395 8.2%
FICO < 660, CLTV > 100% 553 10.3% 504 9.3% 454 9.5% 385 9.9% 359 9.6%
Notes:
– Data appearing in the tables above have been sourced from Citi’s risk systems and, as such, may not
reconcile with disclosures elsewhere generally due to differences in methodology or variations in the
manner in which information is captured. Citi has noted such variations in instances where it believes
they could be material to reconcile to the information presented elsewhere.
– Tables exclude loans in Canada and Puerto Rico, loans guaranteed by U.S. government agencies
(residential first mortgages table only), loans recorded at fair value (residential first mortgages table only)
and loans subject to LTSCs.
– Balances exclude deferred fees/costs.
– Tables exclude balances for which FICO or LTV data is unavailable. For residential first mortgages,
balances for which such data is unavailable include $0.4 billion in each of the periods presented. For
home equity loans, balances for which such data is unavailable include $0.2 billion in each of the
periods presented.