Citibank 2012 Annual Report Download - page 53
Download and view the complete annual report
Please find page 53 of the 2012 Citibank annual report below. You can navigate through the pages in the report by either clicking on the pages listed below, or by using the keyword search tool below to find specific information within the annual report.-
 1
1 -
2
-
3
-
4
-
5
-
6
-
7
-
8
-
9
-
10
-
11
-
12
-
13
-
14
-
15
-
16
-
17
-
18
-
19
-
20
-
21
-
22
-
23
-
24
-
25
-
26
-
27
-
28
-
29
-
30
-
31
-
32
-
33
-
34
-
35
-
36
-
37
-
38
-
39
-
40
-
41
-
42
-
 43
43 -
 44
44 -
 45
45 -
 46
46 -
 47
47 -
 48
48 -
 49
49 -
 50
50 -
 51
51 -
 52
52 -
 53
53 -
 54
54 -
 55
55 -
 56
56 -
 57
57 -
 58
58 -
 59
59 -
 60
60 -
 61
61 -
 62
62 -
 63
63 -
64
-
65
-
66
-
67
-
68
-
69
-
70
-
71
-
72
-
73
-
74
-
75
-
76
-
77
-
78
-
79
-
80
-
81
-
82
-
83
-
84
-
85
-
86
-
87
-
88
-
89
-
90
-
91
-
92
-
93
-
94
-
95
-
96
-
97
-
98
-
99
-
100
-
101
-
102
-
103
-
104
-
105
-
106
-
107
-
108
-
109
-
110
-
111
-
112
-
113
-
114
-
115
-
116
-
117
-
118
-
119
-
120
-
121
-
122
-
123
-
124
-
125
-
126
-
127
-
128
-
129
-
130
-
131
-
132
-
133
-
134
-
135
-
136
-
137
-
138
-
139
-
140
-
141
-
142
-
143
-
144
-
145
-
146
-
147
-
148
-
149
-
150
-
151
-
152
-
153
-
154
-
155
-
156
-
157
-
158
-
159
-
160
-
161
-
162
-
163
-
164
-
165
-
166
-
167
-
168
-
169
-
170
-
171
-
172
-
173
-
174
-
175
-
176
-
177
-
178
-
179
-
180
-
181
-
182
-
183
-
184
-
185
-
186
-
187
-
188
-
189
-
190
-
191
-
192
-
193
-
194
-
195
-
196
-
197
-
198
-
199
-
200
-
201
-
202
-
203
-
204
-
205
-
206
-
207
-
208
-
209
-
210
-
211
-
212
-
213
-
214
-
215
-
216
-
217
-
218
-
219
-
220
-
221
-
222
-
223
-
224
-
225
-
226
-
227
-
228
-
229
-
230
-
231
-
232
-
233
-
234
-
235
-
236
-
237
-
238
-
239
-
240
-
241
-
242
-
243
-
244
-
245
-
246
-
247
-
248
-
249
-
250
-
251
-
252
-
253
-
254
-
255
-
256
-
257
-
258
-
259
-
260
-
261
-
262
-
263
-
264
-
265
-
266
-
267
-
268
-
269
-
270
-
271
-
272
-
273
-
274
-
275
-
276
-
277
-
278
-
279
-
280
-
281
-
282
-
283
-
284
-
285
-
286
-
287
-
288
-
289
-
290
-
291
-
292
-
293
-
294
-
295
-
296
-
297
-
298
-
299
-
300
-
301
-
302
-
303
-
304
-
305
-
306
-
307
-
308
-
309
-
310
-
311
-
312
-
313
-
314
-
315
-
316
-
317
-
318
-
319
-
320
-
321
-
322
-
323
-
324
 |
 |

31
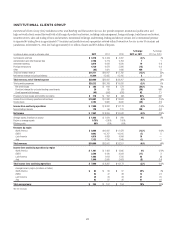
CITI HOLDINGS
Citi Holdings contains businesses and portfolios of assets that Citigroup has determined are not central to its core Citicorp businesses and consists of Brokerage
and Asset Management, Local Consumer Lending and Special Asset Pool.
Consistent with its strategy, Citi intends to continue to exit these businesses and portfolios as quickly as practicable in an economically rational manner.
Citi Holdings assets have declined by approximately $302 billion since the end of 2009. To date, the decrease in Citi Holdings assets has been primarily driven
by asset sales and business dispositions, as well as portfolio run-off and pay-downs. Asset levels have also been impacted, and will continue to be impacted, by
charge-offs and fair value marks as and when appropriate. Citi expects the wind-down of the assets in Citi Holdings will continue, although likely at a slower
pace than experienced over the past several years as Citi has already disposed of some of the larger operating businesses within Citi Holdings (see also “Risk
Factors—Business and Operational Risks” below).
As of December 31, 2012, Citi Holdings assets were approximately $156 billion, a decrease of approximately 31% year-over-year and a decrease of 9% from
September 30, 2012. The decline in assets of $69 billion in 2012 was composed of a decline of approximately $17 billion related to MSSB (primarily consisting
of $6.6 billion related to the sale of Citi’s 14% interest and impairment on the remaining investment and approximately $11 billion of margin loans),
$18 billion of other asset sales and business dispositions, $30 billion of run-off and pay-downs and $4 billion of charge-offs and fair value marks. Citi Holdings
represented approximately 8% of Citi’s assets as of December 31, 2012, while Citi Holdings risk-weighted assets (as defined under current regulatory guidelines)
of approximately $144 billion at December 31, 2012 represented approximately 15% of Citi’s risk-weighted assets as of that date.
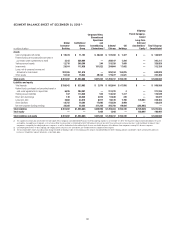
In millions of dollars, except as otherwise noted 2012 2011 2010
% Change
2012 vs. 2011
% Change
2011 vs. 2010
Net interest revenue $ 2,577 $ 3,683 $ 8,085 (30)% (54)%
Non-interest revenue (3,410) 2,588 4,186 NM (38)
Total revenues, net of interest expense $ (833) $ 6,271 $12,271 NM (49)%
Provisions for credit losses and for benefits and claims
Net credit losses $ 5,842 $ 8,576 $13,958 (32)% (39)%
Credit reserve build (release) (1,551) (3,277) (2,494) 53 (31)
Provision for loan losses $ 4,291 $ 5,299 $11,464 (19)% (54)%
Provision for benefits and claims 651 779 781 (16) —
Provision (release) for unfunded lending commitments (56) (41) (82) (37) 50
Total provisions for credit losses and for benefits and claims $ 4,886 $ 6,037 $12,163 (19)% (50)%
Total operating expenses $ 5,253 $ 6,464 $ 7,356 (19)% (12)%
Loss from continuing operations before taxes $(10,972) $(6,230) $ (7,248) (76)% 14%
Benefits for income taxes (4,412) (2,127) (2,815) NM 24
(Loss) from continuing operations $ (6,560) $(4,103) $ (4,433) (60)% 7%
Noncontrolling interests 3119 207 (97) (43)
Citi Holdings net loss $ (6,563) $(4,222) $ (4,640) (55)% 9%
Balance sheet data (in billions of dollars)
Average assets $ 194 $ 269 $ 420 (28)% (36)%
Return on average assets (3.38)% (1.57)% (1.10)%
Efficiency ratio NM 103% 60%
Total EOP assets $ 156 $ 225 $ 313 (31) (28)
Total EOP loans 116 141 199 (18) (29)
Total EOP deposits $ 68 $ 62 $ 76 10 (18)
NM Not meaningful