Citibank 2012 Annual Report Download - page 55
Download and view the complete annual report
Please find page 55 of the 2012 Citibank annual report below. You can navigate through the pages in the report by either clicking on the pages listed below, or by using the keyword search tool below to find specific information within the annual report.-
 1
1 -
2
-
3
-
4
-
5
-
6
-
7
-
8
-
9
-
10
-
11
-
12
-
13
-
14
-
15
-
16
-
17
-
18
-
19
-
20
-
21
-
22
-
23
-
24
-
25
-
26
-
27
-
28
-
29
-
30
-
31
-
32
-
33
-
34
-
35
-
36
-
37
-
38
-
39
-
40
-
41
-
42
-
43
-
44
-
 45
45 -
 46
46 -
 47
47 -
 48
48 -
 49
49 -
 50
50 -
 51
51 -
 52
52 -
 53
53 -
 54
54 -
 55
55 -
 56
56 -
 57
57 -
 58
58 -
 59
59 -
 60
60 -
 61
61 -
 62
62 -
 63
63 -
 64
64 -
 65
65 -
66
-
67
-
68
-
69
-
70
-
71
-
72
-
73
-
74
-
75
-
76
-
77
-
78
-
79
-
80
-
81
-
82
-
83
-
84
-
85
-
86
-
87
-
88
-
89
-
90
-
91
-
92
-
93
-
94
-
95
-
96
-
97
-
98
-
99
-
100
-
101
-
102
-
103
-
104
-
105
-
106
-
107
-
108
-
109
-
110
-
111
-
112
-
113
-
114
-
115
-
116
-
117
-
118
-
119
-
120
-
121
-
122
-
123
-
124
-
125
-
126
-
127
-
128
-
129
-
130
-
131
-
132
-
133
-
134
-
135
-
136
-
137
-
138
-
139
-
140
-
141
-
142
-
143
-
144
-
145
-
146
-
147
-
148
-
149
-
150
-
151
-
152
-
153
-
154
-
155
-
156
-
157
-
158
-
159
-
160
-
161
-
162
-
163
-
164
-
165
-
166
-
167
-
168
-
169
-
170
-
171
-
172
-
173
-
174
-
175
-
176
-
177
-
178
-
179
-
180
-
181
-
182
-
183
-
184
-
185
-
186
-
187
-
188
-
189
-
190
-
191
-
192
-
193
-
194
-
195
-
196
-
197
-
198
-
199
-
200
-
201
-
202
-
203
-
204
-
205
-
206
-
207
-
208
-
209
-
210
-
211
-
212
-
213
-
214
-
215
-
216
-
217
-
218
-
219
-
220
-
221
-
222
-
223
-
224
-
225
-
226
-
227
-
228
-
229
-
230
-
231
-
232
-
233
-
234
-
235
-
236
-
237
-
238
-
239
-
240
-
241
-
242
-
243
-
244
-
245
-
246
-
247
-
248
-
249
-
250
-
251
-
252
-
253
-
254
-
255
-
256
-
257
-
258
-
259
-
260
-
261
-
262
-
263
-
264
-
265
-
266
-
267
-
268
-
269
-
270
-
271
-
272
-
273
-
274
-
275
-
276
-
277
-
278
-
279
-
280
-
281
-
282
-
283
-
284
-
285
-
286
-
287
-
288
-
289
-
290
-
291
-
292
-
293
-
294
-
295
-
296
-
297
-
298
-
299
-
300
-
301
-
302
-
303
-
304
-
305
-
306
-
307
-
308
-
309
-
310
-
311
-
312
-
313
-
314
-
315
-
316
-
317
-
318
-
319
-
320
-
321
-
322
-
323
-
324
 |
 |

33
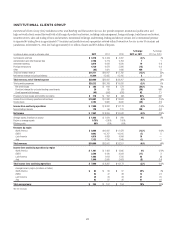
LOCAL CONSUMER LENDING
Local Consumer Lending (LCL) includes a substantial portion of Citigroup’s North America mortgage business (see “North America Consumer Mortgage
Lending” below), CitiFinancial North America (consisting of the OneMain and CitiFinancial Servicing businesses), remaining student loans and credit card
portfolios, and other local consumer finance businesses globally (including Western European cards and retail banking and Japan Consumer Finance). At
December 31, 2012, LCL consisted of approximately $126 billion of assets (with approximately $123 billion in North America), or approximately 81% of Citi
Holdings assets, and thus represents the largest segment within Citi Holdings. The North America assets primarily consist of residential mortgages (residential
first mortgages and home equity loans), which stood at $92 billion as of December 31, 2012.
In millions of dollars, except as otherwise noted 2012 2011 2010
% Change
2012 vs. 2011
% Change
2011 vs. 2010
Net interest revenue $ 3,335 $ 4,268 $ 7,143 (22)% (40)%
Non-interest revenue 1,031 1,174 1,667 (12) (30)
Total revenues, net of interest expense $ 4,366 $ 5,442 $ 8,810 (20)% (38)%
Total operating expenses $ 4,465 $ 5,442 $ 5,798 (18)% (6)%
Net credit losses $ 5,870 $ 7,504 $11,928 (22)% (37)%
Credit reserve build (release) (1,410) (1,419) (765) 1(85)
Provision for benefits and claims 651 731 743 (11) (2)
Provisions for credit losses and for benefits and claims $ 5,111 $ 6,816 $11,906 (25)% (43)%
(Loss) from continuing operations before taxes $(5,210) (6,816) $ (8,894) 24% 23%
Benefits for income taxes (2,017) (2,403) (3,529) 16 32
(Loss) from continuing operations $(3,193) $(4,413) $ (5,365) 28% 18%
Noncontrolling interests —2 8 (100) (75)
Net (loss) $(3,193) $(4,415) $ (5,373) 28% 18%
Balance sheet data (in billions of dollars)
Average assets $ 142 $ 186 $ 280 (24)% (34)%
Return on average assets (2.25)% (2.37)% (1.92)%
Efficiency ratio 102% 100% 66%
EOP assets $ 126 $ 157 $ 206 (20) (24)
Net credit losses as a percentage of average loans 4.72% 4.69% 5.16%
2012 vs. 2011
The net loss decreased by 28%, driven mainly by the improved credit
environment primarily in North America mortgages.
Revenues decreased 20%, primarily due to a 22% net interest revenue
decline resulting from a 24% decline in loan balances. This decline was
driven by continued asset sales, divestitures and run-off. Non-interest
revenue decreased 12%, primarily due to portfolio run-off, partially offset
by a lower repurchase reserve build. The repurchase reserve build was
$700 million compared to $945 million in 2011 (see “Managing Global
Risk—Credit Risk—Citigroup Residential Mortgages—Representations and
Warranties” below).
Expenses decreased 18%, driven by lower volumes and divestitures. Legal
and related expenses in LCL remained elevated due to the previously disclosed
$305 million charge in the fourth quarter of 2012, related to the settlement
agreement reached with the Federal Reserve Board and OCC regarding the
independent foreclosure review process required by the Federal Reserve
Board and OCC consent orders entered into in April 2011 (see “Managing
Global Risk—Credit Risk—North America Consumer Mortgage Lending—
Independent Foreclosure Review Settlement” below). In addition, legal and
related expenses were elevated due to additional reserves related to payment
protection insurance (PPI) (see “Payment Protection Insurance” below) and
other legal and related matters impacting the business.
Provisions decreased 25%, driven primarily by the improved credit
environment in North America mortgages, lower volumes and divestitures.
Net credit losses decreased by 22%, despite being impacted by incremental
charge-offs of approximately $635 million in the third quarter of 2012
relating to OCC guidance regarding the treatment of mortgage loans
where the borrower has gone through Chapter 7 bankruptcy (see Note 1 to
the Consolidated Financial Statements) and $370 million of incremental
charge-offs in the first quarter of 2012 related to previously deferred principal
balances on modified mortgages related to anticipated forgiveness of
principal in connection with the national mortgage settlement. Substantially
all of these charge-offs were offset by reserve releases. In addition, net credit
losses in 2012 were negatively impacted by an additional aggregate amount