Citibank 2012 Annual Report Download - page 110
Download and view the complete annual report
Please find page 110 of the 2012 Citibank annual report below. You can navigate through the pages in the report by either clicking on the pages listed below, or by using the keyword search tool below to find specific information within the annual report.-
 1
1 -
2
-
3
-
4
-
5
-
6
-
7
-
8
-
9
-
10
-
11
-
12
-
13
-
14
-
15
-
16
-
17
-
18
-
19
-
20
-
21
-
22
-
23
-
24
-
25
-
26
-
27
-
28
-
29
-
30
-
31
-
32
-
33
-
34
-
35
-
36
-
37
-
38
-
39
-
40
-
41
-
42
-
43
-
44
-
45
-
46
-
47
-
48
-
49
-
50
-
51
-
52
-
53
-
54
-
55
-
56
-
57
-
58
-
59
-
60
-
61
-
62
-
63
-
64
-
65
-
66
-
67
-
68
-
69
-
70
-
71
-
72
-
73
-
74
-
75
-
76
-
77
-
78
-
79
-
80
-
81
-
82
-
83
-
84
-
85
-
86
-
87
-
88
-
89
-
90
-
91
-
92
-
93
-
94
-
95
-
96
-
97
-
98
-
99
-
 100
100 -
 101
101 -
 102
102 -
 103
103 -
 104
104 -
 105
105 -
 106
106 -
 107
107 -
 108
108 -
 109
109 -
 110
110 -
 111
111 -
 112
112 -
 113
113 -
 114
114 -
 115
115 -
 116
116 -
 117
117 -
 118
118 -
 119
119 -
 120
120 -
121
-
122
-
123
-
124
-
125
-
126
-
127
-
128
-
129
-
130
-
131
-
132
-
133
-
134
-
135
-
136
-
137
-
138
-
139
-
140
-
141
-
142
-
143
-
144
-
145
-
146
-
147
-
148
-
149
-
150
-
151
-
152
-
153
-
154
-
155
-
156
-
157
-
158
-
159
-
160
-
161
-
162
-
163
-
164
-
165
-
166
-
167
-
168
-
169
-
170
-
171
-
172
-
173
-
174
-
175
-
176
-
177
-
178
-
179
-
180
-
181
-
182
-
183
-
184
-
185
-
186
-
187
-
188
-
189
-
190
-
191
-
192
-
193
-
194
-
195
-
196
-
197
-
198
-
199
-
200
-
201
-
202
-
203
-
204
-
205
-
206
-
207
-
208
-
209
-
210
-
211
-
212
-
213
-
214
-
215
-
216
-
217
-
218
-
219
-
220
-
221
-
222
-
223
-
224
-
225
-
226
-
227
-
228
-
229
-
230
-
231
-
232
-
233
-
234
-
235
-
236
-
237
-
238
-
239
-
240
-
241
-
242
-
243
-
244
-
245
-
246
-
247
-
248
-
249
-
250
-
251
-
252
-
253
-
254
-
255
-
256
-
257
-
258
-
259
-
260
-
261
-
262
-
263
-
264
-
265
-
266
-
267
-
268
-
269
-
270
-
271
-
272
-
273
-
274
-
275
-
276
-
277
-
278
-
279
-
280
-
281
-
282
-
283
-
284
-
285
-
286
-
287
-
288
-
289
-
290
-
291
-
292
-
293
-
294
-
295
-
296
-
297
-
298
-
299
-
300
-
301
-
302
-
303
-
304
-
305
-
306
-
307
-
308
-
309
-
310
-
311
-
312
-
313
-
314
-
315
-
316
-
317
-
318
-
319
-
320
-
321
-
322
-
323
-
324
 |
 |
88
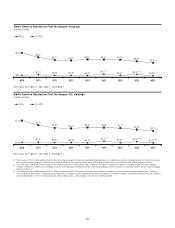
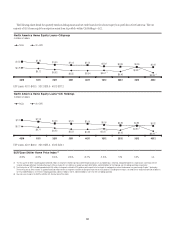
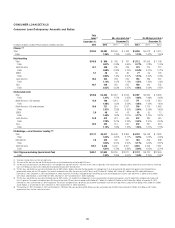
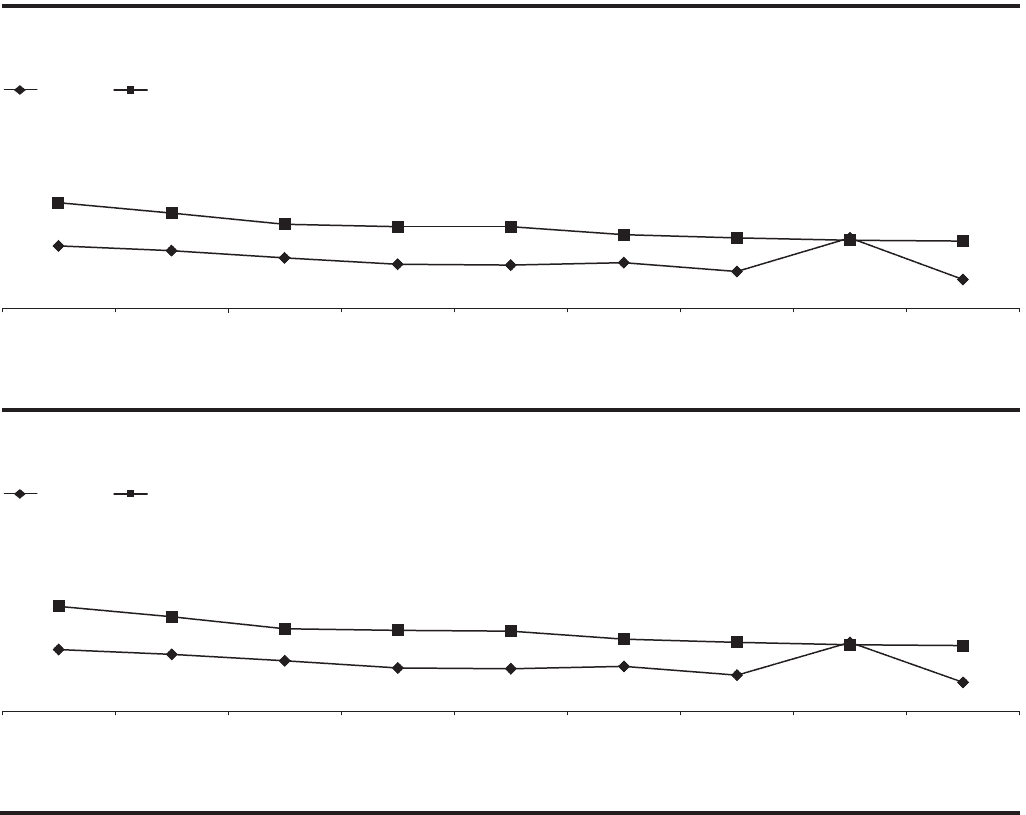
The following charts detail the quarterly trends in delinquencies and net credit losses for Citi’s home equity loan portfolio in North America. The vast
majority of Citi’s home equity loan exposure arises from its portfolio within Citi Holdings—LCL.
4Q10 1Q11 2Q11 3Q11 4Q11 1Q12 2Q12 4Q123Q12
North America Home Equity Loans—Citigroup
In billions of dollars
NCLs 90+DPD
EOP Loans: 4Q11-$43.5 3Q12-$38.6 4Q12-$37.2
$1.32 $1.02
$1.19 $1.05 $1.02 $0.92 $0.88 $0.84
$0.36 (2)
$0.85
$0.88 (2)
$0.46
$0.55
$0.72 $0.63 $0.54 $0.57 (1)
$0.78
4Q10 1Q11 2Q11 3Q11 4Q11 1Q12 2Q12 4Q123Q12
NCLs 90+DPD
$1.31 $1.01
$1.18 $1.03 $1.00 $0.90 $0.86 $0.82
$0.36 (2)
$0.83
$0.86 (2)
$0.45
$0.54
$0.71 $0.63 $0.53 $0.56 (1)
$0.77
EOP Loans: 4Q11-$40.0 3Q12-$35.4 4Q12-$34.1
North America Home Equity Loans—Citi Holdings
In billions of dollars
S&P/Case Shiller Home Price Index(3)
(3.8)% (4.9)% (5.4)% (3.5)% (3.7)% (1.3)% 1.6% 3.6% n/a
(1) The first quarter of 2012 included approximately $55 million of charge-offs related to previously deferred principal balances on modified loans related to anticipated forgiveness of principal in connection with the
national mortgage settlement. Excluding the impact of these charge-offs, net credit losses would have been $0.51 billion and $0.50 billion for the Citigroup and Citi Holdings portfolios, respectively.
(2) The third quarter of 2012 included approximately $454 million of charge-offs related to OCC guidance with respect to the treatment of mortgage loans where the borrower has gone through Chapter 7 bankruptcy.
The fourth quarter of 2012 includes an approximately $30 million benefit to charge-offs related to finalizing the impact of the OCC guidance. Excluding these impacts, net credit losses would have been $0.43 billion in
3Q’12 and $0.39 billion in 4Q’12 for the Citigroup portfolio, and $0.41 billion in 3Q’12 and $0.38 billion in 4Q’12 for the Citi Holdings portfolio.
(3) Year-over-year change in the S&P/Case-Shiller U.S. National Home Price Index.