Citibank 2012 Annual Report Download - page 62
Download and view the complete annual report
Please find page 62 of the 2012 Citibank annual report below. You can navigate through the pages in the report by either clicking on the pages listed below, or by using the keyword search tool below to find specific information within the annual report.-
 1
1 -
2
-
3
-
4
-
5
-
6
-
7
-
8
-
9
-
10
-
11
-
12
-
13
-
14
-
15
-
16
-
17
-
18
-
19
-
20
-
21
-
22
-
23
-
24
-
25
-
26
-
27
-
28
-
29
-
30
-
31
-
32
-
33
-
34
-
35
-
36
-
37
-
38
-
39
-
40
-
41
-
42
-
43
-
44
-
45
-
46
-
47
-
48
-
49
-
50
-
51
-
 52
52 -
 53
53 -
 54
54 -
 55
55 -
 56
56 -
 57
57 -
 58
58 -
 59
59 -
 60
60 -
 61
61 -
 62
62 -
 63
63 -
 64
64 -
 65
65 -
 66
66 -
 67
67 -
 68
68 -
 69
69 -
 70
70 -
 71
71 -
 72
72 -
73
-
74
-
75
-
76
-
77
-
78
-
79
-
80
-
81
-
82
-
83
-
84
-
85
-
86
-
87
-
88
-
89
-
90
-
91
-
92
-
93
-
94
-
95
-
96
-
97
-
98
-
99
-
100
-
101
-
102
-
103
-
104
-
105
-
106
-
107
-
108
-
109
-
110
-
111
-
112
-
113
-
114
-
115
-
116
-
117
-
118
-
119
-
120
-
121
-
122
-
123
-
124
-
125
-
126
-
127
-
128
-
129
-
130
-
131
-
132
-
133
-
134
-
135
-
136
-
137
-
138
-
139
-
140
-
141
-
142
-
143
-
144
-
145
-
146
-
147
-
148
-
149
-
150
-
151
-
152
-
153
-
154
-
155
-
156
-
157
-
158
-
159
-
160
-
161
-
162
-
163
-
164
-
165
-
166
-
167
-
168
-
169
-
170
-
171
-
172
-
173
-
174
-
175
-
176
-
177
-
178
-
179
-
180
-
181
-
182
-
183
-
184
-
185
-
186
-
187
-
188
-
189
-
190
-
191
-
192
-
193
-
194
-
195
-
196
-
197
-
198
-
199
-
200
-
201
-
202
-
203
-
204
-
205
-
206
-
207
-
208
-
209
-
210
-
211
-
212
-
213
-
214
-
215
-
216
-
217
-
218
-
219
-
220
-
221
-
222
-
223
-
224
-
225
-
226
-
227
-
228
-
229
-
230
-
231
-
232
-
233
-
234
-
235
-
236
-
237
-
238
-
239
-
240
-
241
-
242
-
243
-
244
-
245
-
246
-
247
-
248
-
249
-
250
-
251
-
252
-
253
-
254
-
255
-
256
-
257
-
258
-
259
-
260
-
261
-
262
-
263
-
264
-
265
-
266
-
267
-
268
-
269
-
270
-
271
-
272
-
273
-
274
-
275
-
276
-
277
-
278
-
279
-
280
-
281
-
282
-
283
-
284
-
285
-
286
-
287
-
288
-
289
-
290
-
291
-
292
-
293
-
294
-
295
-
296
-
297
-
298
-
299
-
300
-
301
-
302
-
303
-
304
-
305
-
306
-
307
-
308
-
309
-
310
-
311
-
312
-
313
-
314
-
315
-
316
-
317
-
318
-
319
-
320
-
321
-
322
-
323
-
324
 |
 |

40
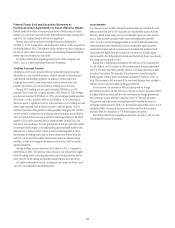
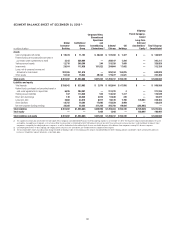
SEGMENT BALANCE SHEET AT DECEMBER 31, 2012 (1)
In millions of dollars
Global
Consumer
Banking
Institutional
Clients
Group
Corporate/Other,
Discontinued
Operations
and
Consolidating
Eliminations (2)
Subtotal
Citicorp
Citi
Holdings
Citigroup
Parent Company-
Issued
Long-Term
Debt and
Stockholders’
Equity
(3)
Total Citigroup
Consolidated
Assets
Cash and deposits with banks $ 19,474 $ 71,152 $ 46,634 $ 137,260 $ 1,327 $ — $ 138,587
Federal funds sold and securities borrowed or
purchased under agreements to resell 3,243 256,864 — 260,107 1,204 — 261,311
Trading account assets 12,716 300,360 244 313,320 7,609 — 320,929
Investments 29,914 112,928 151,822 294,664 17,662 — 312,326
Loans, net of unearned income and
allowance for loan losses 283,365 241,819 — 525,184 104,825 — 630,009
Other assets 53,180 75,543 49,154 177,877 23,621 — 201,498
Total assets $ 401,892 $1,058,666 $247,854 $1,708,412 $156,248 $ — $1,864,660
Liabilities and equity
Total deposits $336,942 $ 523,083 $ 2,579 $ 862,604 $ 67,956 $ — $ 930,560
Federal funds purchased and securities loaned or
sold under agreements to repurchase 6,835 204,397 — 211,232 4 — 211,236
Trading account liabilities 167 113,530 535 114,232 1,317 — 115,549
Short-term borrowings 140 46,535 4,974 51,649 378 — 52,027
Long-term debt 2,688 43,515 8,917 55,120 7,790 176,553 239,463
Other liabilities 18,752 79,384 17,693 115,829 8,999 — 124,828
Net inter-segment funding (lending) 36,368 48,222 211,208 295,798 69,804 (365,602) —
Total liabilities $ 401,892 $1,058,666 $245,906 $1,706,464 $156,248 $(189,049) $1,673,663
Total equity — — 1,948 1,948 — 189,049 190,997
Total liabilities and equity $ 401,892 $1,058,666 $247,854 $1,708,412 $156,248 $ — $1,864,660
(1) The supplemental information presented in the table above reflects Citigroup’s consolidated GAAP balance sheet by reporting segment as of December 31, 2012. The respective segment information depicts the assets
and liabilities managed by each segment as of such date. While this presentation is not defined by GAAP, Citi believes that these non-GAAP financial measures enhance investors’ understanding of the balance sheet
components managed by the underlying business segments, as well as the beneficial inter-relationship of the asset and liability dynamics of the balance sheet components among Citi’s business segments.
(2) Consolidating eliminations for total Citigroup and Citigroup parent company assets and liabilities are recorded within the Corporate/Other segment.
(3) The total stockholders’ equity and substantially all long-term debt of Citigroup resides in the Citigroup parent company Consolidated Balance Sheet. Citigroup allocates stockholders’ equity and long-term debt to its
businesses through inter-segment allocations as described above.