Citibank 2012 Annual Report Download - page 61
Download and view the complete annual report
Please find page 61 of the 2012 Citibank annual report below. You can navigate through the pages in the report by either clicking on the pages listed below, or by using the keyword search tool below to find specific information within the annual report.-
 1
1 -
2
-
3
-
4
-
5
-
6
-
7
-
8
-
9
-
10
-
11
-
12
-
13
-
14
-
15
-
16
-
17
-
18
-
19
-
20
-
21
-
22
-
23
-
24
-
25
-
26
-
27
-
28
-
29
-
30
-
31
-
32
-
33
-
34
-
35
-
36
-
37
-
38
-
39
-
40
-
41
-
42
-
43
-
44
-
45
-
46
-
47
-
48
-
49
-
50
-
 51
51 -
 52
52 -
 53
53 -
 54
54 -
 55
55 -
 56
56 -
 57
57 -
 58
58 -
 59
59 -
 60
60 -
 61
61 -
 62
62 -
 63
63 -
 64
64 -
 65
65 -
 66
66 -
 67
67 -
 68
68 -
 69
69 -
 70
70 -
 71
71 -
72
-
73
-
74
-
75
-
76
-
77
-
78
-
79
-
80
-
81
-
82
-
83
-
84
-
85
-
86
-
87
-
88
-
89
-
90
-
91
-
92
-
93
-
94
-
95
-
96
-
97
-
98
-
99
-
100
-
101
-
102
-
103
-
104
-
105
-
106
-
107
-
108
-
109
-
110
-
111
-
112
-
113
-
114
-
115
-
116
-
117
-
118
-
119
-
120
-
121
-
122
-
123
-
124
-
125
-
126
-
127
-
128
-
129
-
130
-
131
-
132
-
133
-
134
-
135
-
136
-
137
-
138
-
139
-
140
-
141
-
142
-
143
-
144
-
145
-
146
-
147
-
148
-
149
-
150
-
151
-
152
-
153
-
154
-
155
-
156
-
157
-
158
-
159
-
160
-
161
-
162
-
163
-
164
-
165
-
166
-
167
-
168
-
169
-
170
-
171
-
172
-
173
-
174
-
175
-
176
-
177
-
178
-
179
-
180
-
181
-
182
-
183
-
184
-
185
-
186
-
187
-
188
-
189
-
190
-
191
-
192
-
193
-
194
-
195
-
196
-
197
-
198
-
199
-
200
-
201
-
202
-
203
-
204
-
205
-
206
-
207
-
208
-
209
-
210
-
211
-
212
-
213
-
214
-
215
-
216
-
217
-
218
-
219
-
220
-
221
-
222
-
223
-
224
-
225
-
226
-
227
-
228
-
229
-
230
-
231
-
232
-
233
-
234
-
235
-
236
-
237
-
238
-
239
-
240
-
241
-
242
-
243
-
244
-
245
-
246
-
247
-
248
-
249
-
250
-
251
-
252
-
253
-
254
-
255
-
256
-
257
-
258
-
259
-
260
-
261
-
262
-
263
-
264
-
265
-
266
-
267
-
268
-
269
-
270
-
271
-
272
-
273
-
274
-
275
-
276
-
277
-
278
-
279
-
280
-
281
-
282
-
283
-
284
-
285
-
286
-
287
-
288
-
289
-
290
-
291
-
292
-
293
-
294
-
295
-
296
-
297
-
298
-
299
-
300
-
301
-
302
-
303
-
304
-
305
-
306
-
307
-
308
-
309
-
310
-
311
-
312
-
313
-
314
-
315
-
316
-
317
-
318
-
319
-
320
-
321
-
322
-
323
-
324
 |
 |
39
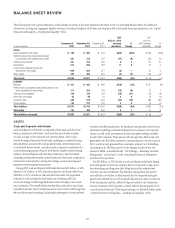
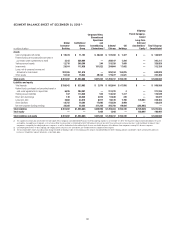
Loans
Loans represent the largest asset category of Citi’s balance sheet. Citi’s total
loans (as discussed throughout this section, are presented net of unearned
income) were $655 billion at December 31, 2012, compared to $647 billion
at December 31, 2011. Excluding the impact of FX translation, loans
increased 1% year-over-year. At year-end 2012, Consumer and Corporate
loans represented 62% and 38%, respectively, of Citi’s total loans.
In Citicorp, loans were up 7% to $540 billion at year end 2012, as
compared to $507 billion at the end of 2011. Citicorp Corporate loans
increased 11% year-over-year, and Citicorp Consumer loans were up
3% year-over-year.
Corporate loan growth was driven by Transaction Services (25% growth),
particularly from increased trade finance lending in most regions, as well as
growth in the Securities and Banking Corporate loan book (6% growth),
with increased borrowing generally across most segments and regions.
Growth in Corporate lending included increases in Private Bank and certain
middle-market client segments overseas, with other Corporate lending
segments down slightly as compared to year-end 2011. During 2012, Citi
continued to optimize the Corporate lending portfolio, including selling
certain loans that did not fit its target market profile.
Consumer loan growth was driven by Global Consumer Banking, as
loans increased 3% year-over-year, led by Latin America and Asia. North
America Consumer loans decreased 1%, driven by declines in card loans, as
the cards market reflected overall consumer deleveraging as well as other
regulatory changes. Retail lending in North America, however, increased
10% year-over-year, as a result of higher real estate lending as well as growth
in the commercial segment.
In contrast, Citi Holdings loans declined 18% year-over-year, due to the
continued run-off and asset sales in the portfolios.
During 2012, average loans of $649 billion yielded an average rate of
7.5%, compared to $644 billion and 7.8%, respectively, in the prior year.
For further information on Citi’s loan portfolios, see generally “Managing
Global Risk—Credit Risk” below and Notes 1 and 16 to the Consolidated
Financial Statements.
Other Assets
Other assets consists of Brokerage receivables, Goodwill, Intangibles and
Mortgage servicing rights in addition to Other assets (including, among other
items, loans held-for-sale, deferred tax assets, equity-method investments,
interest and fees receivable, premises and equipment, certain end-user
derivatives in a net receivable position, repossessed assets and other receivables).
During 2012, other assets decreased $10 billion, or 5%, primarily due to
a $5 billion decrease in brokerage receivables, a $3 billion decrease in other
assets, a $1 billion decrease in mortgage servicing rights (see “Managing Global
Risk—Credit Risk—North America Consumer Mortgage Lending—Mortgage
Servicing Rights” below), and a $1 billion decrease in intangible assets.
For further information on brokerage receivables, see Note 13 to the
Consolidated Financial Statements. For further information regarding goodwill
and intangible assets, see Note 18 to the Consolidated Financial Statements.
LIABILITIES
Deposits
Deposits represent customer funds that are payable on demand or upon
maturity. For a discussion of Citi’s deposits, see “Capital Resources and
Liquidity—Funding and Liquidity” below.
Federal Funds Purchased and Securities Loaned or Sold
Under Agreements to Repurchase (Repos)
Federal funds purchased consist of unsecured advances of excess balances in
reserve accounts held at the Federal Reserve Banks from third parties. During
2011 and 2012, Citi’s federal funds purchased were not significant.
For further information on Citi’s secured financing transactions,
including repos and securities lending transactions, see “Capital Resources
and Liquidity—Funding and Liquidity” below. See also Notes 1 and 12 to
the Consolidated Financial Statements for additional information on these
balance sheet categories.
Trading Account Liabilities
Trading account liabilities includes securities sold, not yet purchased
(short positions), and derivatives in a net payable position, as well as certain
liabilities that Citigroup has elected to carry at fair value.
During 2012, trading account liabilities decreased by $10 billion, or
8%, primarily due to a $5 billion, or 8%, decrease in derivative liabilities,
and a reduction in short equity positions. In 2012, average trading account
liabilities were $74 billion, compared to $86 billion in 2011, primarily due to
lower average volumes of short equity positions.
For further information on Citi’s trading account liabilities, see Notes 1
and 14 to the Consolidated Financial Statements.
Debt
Debt is composed of both short-term and long-term borrowings. Short-term
borrowings include commercial paper and borrowings from unaffiliated
banks and other market participants. Long-term borrowings include senior
notes, subordinated notes, trust preferred securities and securitizations. For
further information on Citi’s long-term and short-term debt borrowings
during 2012, see “Capital Resources and Liquidity—Funding and Liquidity”
below and Notes 1 and 19 to the Consolidated Financial Statements.
Other Liabilities
Other liabilities consists of Brokerage payables and Other liabilities
(including, among other items, accrued expenses and other payables,
deferred tax liabilities, certain end-user derivatives in a net payable position,
and reserves for legal claims, taxes, restructuring, unfunded lending
commitments, and other matters).
During 2012, other liabilities decreased $1 billion, or 1%. For further
information regarding Brokerage payables, see Note 13 to the Consolidated
Financial Statements.