Citibank 2012 Annual Report Download - page 67
Download and view the complete annual report
Please find page 67 of the 2012 Citibank annual report below. You can navigate through the pages in the report by either clicking on the pages listed below, or by using the keyword search tool below to find specific information within the annual report.-
 1
1 -
2
-
3
-
4
-
5
-
6
-
7
-
8
-
9
-
10
-
11
-
12
-
13
-
14
-
15
-
16
-
17
-
18
-
19
-
20
-
21
-
22
-
23
-
24
-
25
-
26
-
27
-
28
-
29
-
30
-
31
-
32
-
33
-
34
-
35
-
36
-
37
-
38
-
39
-
40
-
41
-
42
-
43
-
44
-
45
-
46
-
47
-
48
-
49
-
50
-
51
-
52
-
53
-
54
-
55
-
56
-
 57
57 -
 58
58 -
 59
59 -
 60
60 -
 61
61 -
 62
62 -
 63
63 -
 64
64 -
 65
65 -
 66
66 -
 67
67 -
 68
68 -
 69
69 -
 70
70 -
 71
71 -
 72
72 -
 73
73 -
 74
74 -
 75
75 -
 76
76 -
 77
77 -
78
-
79
-
80
-
81
-
82
-
83
-
84
-
85
-
86
-
87
-
88
-
89
-
90
-
91
-
92
-
93
-
94
-
95
-
96
-
97
-
98
-
99
-
100
-
101
-
102
-
103
-
104
-
105
-
106
-
107
-
108
-
109
-
110
-
111
-
112
-
113
-
114
-
115
-
116
-
117
-
118
-
119
-
120
-
121
-
122
-
123
-
124
-
125
-
126
-
127
-
128
-
129
-
130
-
131
-
132
-
133
-
134
-
135
-
136
-
137
-
138
-
139
-
140
-
141
-
142
-
143
-
144
-
145
-
146
-
147
-
148
-
149
-
150
-
151
-
152
-
153
-
154
-
155
-
156
-
157
-
158
-
159
-
160
-
161
-
162
-
163
-
164
-
165
-
166
-
167
-
168
-
169
-
170
-
171
-
172
-
173
-
174
-
175
-
176
-
177
-
178
-
179
-
180
-
181
-
182
-
183
-
184
-
185
-
186
-
187
-
188
-
189
-
190
-
191
-
192
-
193
-
194
-
195
-
196
-
197
-
198
-
199
-
200
-
201
-
202
-
203
-
204
-
205
-
206
-
207
-
208
-
209
-
210
-
211
-
212
-
213
-
214
-
215
-
216
-
217
-
218
-
219
-
220
-
221
-
222
-
223
-
224
-
225
-
226
-
227
-
228
-
229
-
230
-
231
-
232
-
233
-
234
-
235
-
236
-
237
-
238
-
239
-
240
-
241
-
242
-
243
-
244
-
245
-
246
-
247
-
248
-
249
-
250
-
251
-
252
-
253
-
254
-
255
-
256
-
257
-
258
-
259
-
260
-
261
-
262
-
263
-
264
-
265
-
266
-
267
-
268
-
269
-
270
-
271
-
272
-
273
-
274
-
275
-
276
-
277
-
278
-
279
-
280
-
281
-
282
-
283
-
284
-
285
-
286
-
287
-
288
-
289
-
290
-
291
-
292
-
293
-
294
-
295
-
296
-
297
-
298
-
299
-
300
-
301
-
302
-
303
-
304
-
305
-
306
-
307
-
308
-
309
-
310
-
311
-
312
-
313
-
314
-
315
-
316
-
317
-
318
-
319
-
320
-
321
-
322
-
323
-
324
 |
 |

45
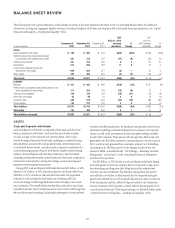
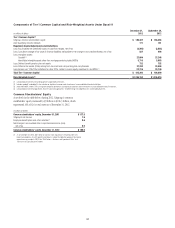
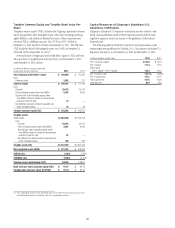
Tangible Common Equity and Tangible Book Value Per
Share
Tangible common equity (TCE), as defined by Citigroup, represents common
equity less goodwill, other intangible assets (other than mortgage servicing
rights (MSRs)), and related net deferred tax assets. Other companies may
calculate TCE in a different manner. Citi’s TCE was $155.1 billion at
December 31, 2012 and $145.4 billion at December 31, 2011. The TCE ratio
(TCE divided by Basel I risk-weighted assets) was 16.0% at December 31,
2012 and 14.9% at December 31, 2011.13
A reconciliation of Citigroup’s total stockholders’ equity to TCE, and book
value per share to tangible book value per share, as of December 31, 2012
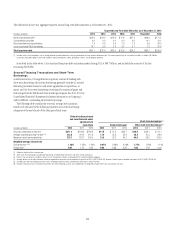
and December 31, 2011, follows:
In millions of dollars or shares at year end,
except ratios and per share data 2012 2011
Total Citigroup stockholders’ equity $ 189,049 $ 177,806
Less:
Preferred stock 2,562 312
Common equity $ 186,487 $ 177,494
Less:
Goodwill 25,673 25,413
Other intangible assets (other than MSRs) 5,697 6,600
Goodwill and other intangible assets (other
than MSRs) related to assets for discontinued
operations held for sale 32 —
Net deferred tax assets related to goodwill and
other intangible assets 32 44
Tangible common equity (TCE) $ 155,053 $ 145,437
Tangible assets
GAAP assets $1,864,660 $1,873,878
Less:
Goodwill 25,673 25,413
Other intangible assets (other than MSRs) 5,697 6,600
Goodwill and other intangible assets (other
than MSRs) related to assets for discontinued
operations held for sale 32 —
Net deferred tax assets related to goodwill and
other intangible assets 309 322
Tangible assets (TA) $1,832,949 $1,841,543
Risk-weighted assets (RWA) $ 971,253 $ 973,369
TCE/TA ratio 8.46% 7.90%
TCE/RWA ratio 15.96% 14.94%
Common shares outstanding (CSO) 3,028.9 2,923.9
Book value per share (common equity/CSO) $ 61.57 $ 60.70
Tangible book value per share (TCE/CSO) $ 51.19 $ 49.74
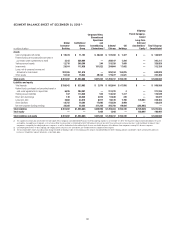
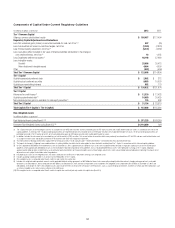
Capital Resources of Citigroup’s Subsidiary U.S.
Depository Institutions
Citigroup’s subsidiary U.S. depository institutions are also subject to risk-
based capital guidelines issued by their respective primary federal bank
regulatory agencies, which are similar to the guidelines of the Federal
Reserve Board.
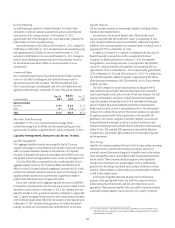
The following table sets forth the capital tiers and capital ratios under
current regulatory guidelines for Citibank, N.A., Citi’s primary subsidiary U.S.
depository institution, as of December 31, 2012 and December 31, 2011:
In billions of dollars, except ratios 2012 2011
Tier 1 Common Capital $116.6 $ 121.3
Tier 1 Capital 117.4 121.9
Total Capital
(Tier 1 Capital + Tier 2 Capital) 135.5 134.3
Tier 1 Common ratio 14.12% 14.63%
Tier 1 Capital ratio 14.21 14.70
Total Capital ratio 16.41 16.20
Leverage ratio 8.97 9.66
13 TCE, tangible book value per share and related ratios are non-GAAP financial measures that are used
and relied upon by investors and industry analysts as capital adequacy metrics.