Citibank 2012 Annual Report Download - page 279
Download and view the complete annual report
Please find page 279 of the 2012 Citibank annual report below. You can navigate through the pages in the report by either clicking on the pages listed below, or by using the keyword search tool below to find specific information within the annual report.-
 1
1 -
2
-
3
-
4
-
5
-
6
-
7
-
8
-
9
-
10
-
11
-
12
-
13
-
14
-
15
-
16
-
17
-
18
-
19
-
20
-
21
-
22
-
23
-
24
-
25
-
26
-
27
-
28
-
29
-
30
-
31
-
32
-
33
-
34
-
35
-
36
-
37
-
38
-
39
-
40
-
41
-
42
-
43
-
44
-
45
-
46
-
47
-
48
-
49
-
50
-
51
-
52
-
53
-
54
-
55
-
56
-
57
-
58
-
59
-
60
-
61
-
62
-
63
-
64
-
65
-
66
-
67
-
68
-
69
-
70
-
71
-
72
-
73
-
74
-
75
-
76
-
77
-
78
-
79
-
80
-
81
-
82
-
83
-
84
-
85
-
86
-
87
-
88
-
89
-
90
-
91
-
92
-
93
-
94
-
95
-
96
-
97
-
98
-
99
-
100
-
101
-
102
-
103
-
104
-
105
-
106
-
107
-
108
-
109
-
110
-
111
-
112
-
113
-
114
-
115
-
116
-
117
-
118
-
119
-
120
-
121
-
122
-
123
-
124
-
125
-
126
-
127
-
128
-
129
-
130
-
131
-
132
-
133
-
134
-
135
-
136
-
137
-
138
-
139
-
140
-
141
-
142
-
143
-
144
-
145
-
146
-
147
-
148
-
149
-
150
-
151
-
152
-
153
-
154
-
155
-
156
-
157
-
158
-
159
-
160
-
161
-
162
-
163
-
164
-
165
-
166
-
167
-
168
-
169
-
170
-
171
-
172
-
173
-
174
-
175
-
176
-
177
-
178
-
179
-
180
-
181
-
182
-
183
-
184
-
185
-
186
-
187
-
188
-
189
-
190
-
191
-
192
-
193
-
194
-
195
-
196
-
197
-
198
-
199
-
200
-
201
-
202
-
203
-
204
-
205
-
206
-
207
-
208
-
209
-
210
-
211
-
212
-
213
-
214
-
215
-
216
-
217
-
218
-
219
-
220
-
221
-
222
-
223
-
224
-
225
-
226
-
227
-
228
-
229
-
230
-
231
-
232
-
233
-
234
-
235
-
236
-
237
-
238
-
239
-
240
-
241
-
242
-
243
-
244
-
245
-
246
-
247
-
248
-
249
-
250
-
251
-
252
-
253
-
254
-
255
-
256
-
257
-
258
-
259
-
260
-
261
-
262
-
263
-
264
-
265
-
266
-
267
-
268
-
 269
269 -
 270
270 -
 271
271 -
 272
272 -
 273
273 -
 274
274 -
 275
275 -
 276
276 -
 277
277 -
 278
278 -
 279
279 -
 280
280 -
 281
281 -
 282
282 -
 283
283 -
 284
284 -
 285
285 -
 286
286 -
 287
287 -
 288
288 -
 289
289 -
290
-
291
-
292
-
293
-
294
-
295
-
296
-
297
-
298
-
299
-
300
-
301
-
302
-
303
-
304
-
305
-
306
-
307
-
308
-
309
-
310
-
311
-
312
-
313
-
314
-
315
-
316
-
317
-
318
-
319
-
320
-
321
-
322
-
323
-
324
 |
 |
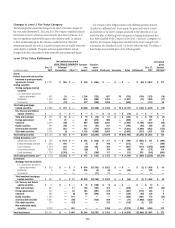
257
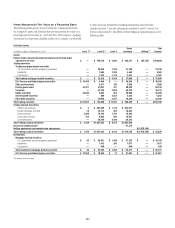
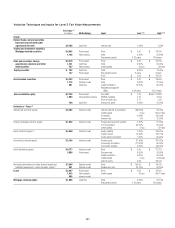
In millions of dollars at December 31, 2011 Level 1 Level 2 Level 3
Gross
inventory Netting (1)
Net
balance
State and municipal $ — $ 13,732 $ 667 $ 14,399 $ — $ 14,399
Foreign government 33,544 50,523 447 84,514 — 84,514
Corporate — 9,268 989 10,257 — 10,257
Equity securities 6,634 98 1,453 8,185 — 8,185
Asset-backed securities — 6,962 4,041 11,003 — 11,003
Other debt securities — 563 120 683 — 683
Non-marketable equity securities — 518 8,318 8,836 — 8,836
Total investments $ 51,879 $ 205,364 $16,797 $ 274,040 $ — $274,040
Loans (2) $ — $ 583 $ 4,682 $ 5,265 $ — $ 5,265
Mortgage servicing rights — — 2,569 2,569 — 2,569
Nontrading derivatives and other financial assets measured
on a recurring basis, gross $ — $ 14,270 $ 2,245 $ 16,515
Gross cash collateral paid 307
Netting agreements and market value adjustments $ (3,462)
Nontrading derivatives and other financial assets measured
on a recurring basis $ — $ 14,270 $ 2,245 $ 16,822 $ (3,462) $ 13,360
Total assets $152,892 $1,482,566 $61,299 $1,754,879 $ (1,025,049) $729,830
Total as a percentage of gross assets (3) 9.0% 87.4% 3.6 % 100.0%
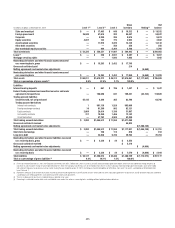
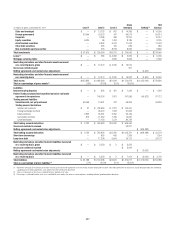
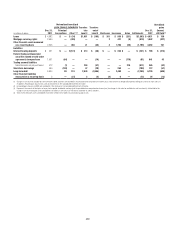
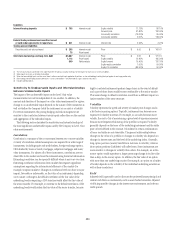
Liabilities
Interest-bearing deposits $ — $ 895 $ 431 $ 1,326 $ — $ 1,326
Federal funds purchased and securities loaned or sold under
agreements to repurchase — 146,524 1,061 147,585 (49,873) 97,712
Trading account liabilities
Securities sold, not yet purchased 58,456 10,941 412 69,809 69,809
Trading account derivatives
Interest rate contracts $ 37 $ 738,833 $ 1,221 $ 740,091
Foreign exchange contracts — 96,020 1,343 97,363
Equity contracts 2,822 26,961 3,356 33,139
Commodity contracts 873 11,959 1,799 14,631
Credit derivatives — 77,153 7,573 84,726
Total trading account derivatives $ 3,732 $ 950,926 $15,292 $ 969,950
Gross cash collateral received 52,811
Netting agreements and market value adjustments $ (966,488)
Total trading account derivatives $ 3,732 $ 950,926 $15,292 $1,022,761 $ (966,488) $ 56,273
Short-term borrowings — 855 499 1,354 — 1,354
Long-term debt — 17,268 6,904 24,172 — 24,172
Nontrading derivatives and other financial liabilities measured
on a recurring basis, gross $ — $ 3,559 $ 3 $ 3,562
Gross cash collateral received $ 3,642
Netting agreements and market value adjustments $ (3,462)
Nontrading derivatives and other financial liabilities measured
on a recurring basis $ — $ 3,559 $ 3 $ 7,204 $ (3,462) $ 3,742
Total liabilities $ 62,188 $1,130,968 $24,602 $1,274,211 $ (1,019,823) $254,388
Total as a percentage of gross liabilities (3) 5.1% 92.9% 2.0 % 100.0%
(1) Represents netting of: (i) the amounts due under securities purchased under agreements to resell and the amounts owed under securities sold under agreements to repurchase; and (ii) derivative exposures covered by
a qualifying master netting agreement, cash collateral and the market value adjustment.
(2) There is no allowance for loan losses recorded for loans reported at fair value.
(3) Percentage is calculated based on total assets and liabilities measured at fair value on a recurring basis, excluding collateral paid/received on derivatives.