Citibank 2012 Annual Report Download - page 49
Download and view the complete annual report
Please find page 49 of the 2012 Citibank annual report below. You can navigate through the pages in the report by either clicking on the pages listed below, or by using the keyword search tool below to find specific information within the annual report.-
 1
1 -
2
-
3
-
4
-
5
-
6
-
7
-
8
-
9
-
10
-
11
-
12
-
13
-
14
-
15
-
16
-
17
-
18
-
19
-
20
-
21
-
22
-
23
-
24
-
25
-
26
-
27
-
28
-
29
-
30
-
31
-
32
-
33
-
34
-
35
-
36
-
37
-
38
-
 39
39 -
 40
40 -
 41
41 -
 42
42 -
 43
43 -
 44
44 -
 45
45 -
 46
46 -
 47
47 -
 48
48 -
 49
49 -
 50
50 -
 51
51 -
 52
52 -
 53
53 -
 54
54 -
 55
55 -
 56
56 -
 57
57 -
 58
58 -
 59
59 -
60
-
61
-
62
-
63
-
64
-
65
-
66
-
67
-
68
-
69
-
70
-
71
-
72
-
73
-
74
-
75
-
76
-
77
-
78
-
79
-
80
-
81
-
82
-
83
-
84
-
85
-
86
-
87
-
88
-
89
-
90
-
91
-
92
-
93
-
94
-
95
-
96
-
97
-
98
-
99
-
100
-
101
-
102
-
103
-
104
-
105
-
106
-
107
-
108
-
109
-
110
-
111
-
112
-
113
-
114
-
115
-
116
-
117
-
118
-
119
-
120
-
121
-
122
-
123
-
124
-
125
-
126
-
127
-
128
-
129
-
130
-
131
-
132
-
133
-
134
-
135
-
136
-
137
-
138
-
139
-
140
-
141
-
142
-
143
-
144
-
145
-
146
-
147
-
148
-
149
-
150
-
151
-
152
-
153
-
154
-
155
-
156
-
157
-
158
-
159
-
160
-
161
-
162
-
163
-
164
-
165
-
166
-
167
-
168
-
169
-
170
-
171
-
172
-
173
-
174
-
175
-
176
-
177
-
178
-
179
-
180
-
181
-
182
-
183
-
184
-
185
-
186
-
187
-
188
-
189
-
190
-
191
-
192
-
193
-
194
-
195
-
196
-
197
-
198
-
199
-
200
-
201
-
202
-
203
-
204
-
205
-
206
-
207
-
208
-
209
-
210
-
211
-
212
-
213
-
214
-
215
-
216
-
217
-
218
-
219
-
220
-
221
-
222
-
223
-
224
-
225
-
226
-
227
-
228
-
229
-
230
-
231
-
232
-
233
-
234
-
235
-
236
-
237
-
238
-
239
-
240
-
241
-
242
-
243
-
244
-
245
-
246
-
247
-
248
-
249
-
250
-
251
-
252
-
253
-
254
-
255
-
256
-
257
-
258
-
259
-
260
-
261
-
262
-
263
-
264
-
265
-
266
-
267
-
268
-
269
-
270
-
271
-
272
-
273
-
274
-
275
-
276
-
277
-
278
-
279
-
280
-
281
-
282
-
283
-
284
-
285
-
286
-
287
-
288
-
289
-
290
-
291
-
292
-
293
-
294
-
295
-
296
-
297
-
298
-
299
-
300
-
301
-
302
-
303
-
304
-
305
-
306
-
307
-
308
-
309
-
310
-
311
-
312
-
313
-
314
-
315
-
316
-
317
-
318
-
319
-
320
-
321
-
322
-
323
-
324
 |
 |

27
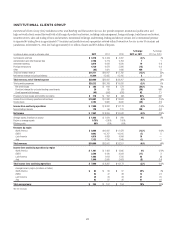
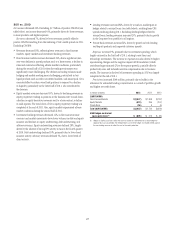
2011 vs. 2010
Net income decreased 24%. Excluding $1.7 billion of positive CVA/DVA (see
table below), net income decreased 43%, primarily driven by lower revenues
in most products and higher expenses.
Revenues decreased 7%, driven by lower revenues partially offset by
positive CVA/DVA resulting from the widening of Citi’s credit spreads in 2011.
Excluding CVA/DVA:
• Revenues decreased 16%, reflecting lower revenues in fixed income
markets, equity markets and investment banking revenues.
• Fixed income markets revenues decreased 24%, due to significant year-
over-year declines in spread products and, to a lesser extent, a decline in
rates and currencies reflecting adverse market conditions, particularly
during the second half of 2011 when the trading environment was
significantly more challenging. The declines in trading volumes made
hedging and market-making more challenging, particularly in less
liquid products such as credit, securitized markets, and municipals. Citi’s
concerted effort to reduce overall risk positions to respond to a decline
in liquidity, particularly in the latter half of 2011, also contributed to
the decrease.
• Equity markets revenues decreased 35%, driven by declining revenues in
equity proprietary trading as positions in the business were wound down,
a decline in equity derivatives revenues and, to a lesser extent, a decline
in cash equities. The wind-down of Citi’s equity proprietary trading was
completed at the end of 2011. Also, equity markets experienced adverse
market conditions during the second half of 2011.
• Investment banking revenues decreased 14%, as the macroeconomic
concerns and market uncertainty drove lower volumes in debt and equity
issuance and declines in equity underwriting, debt underwriting, and
advisory revenues. Equity underwriting revenues declined 28%, largely
driven by the absence of strong IPO activity in Asia in the fourth quarter
of 2010. Debt underwriting declined 10%, primarily due to lower bond
issuance activity. Advisory revenues declined 5%, due to lower levels of
client activity.
• Lending revenues increased 86%, driven by a mark-to-market gain in
hedges related to accrual loans (see table below), resulting from CDS
spreads widening during 2011. Excluding lending hedges related to
accrual loans, lending revenues increased 25%, primarily due to growth
in the Corporate loan portfolio in all regions.
• Private Bank revenues increased 6%, driven by growth in both lending
and deposit products and improved customer spreads.
Expenses increased 3%, primarily due to investment spending, which
largely occurred in the first half of 2011, relating to new hires and
technology investments. The increase in expenses was also driven by higher
repositioning charges and the negative impact of FX translation (which
contributed approximately 2% to the expense growth), partially offset by
productivity saves and reduced incentive compensation due to business
results. The increase in the level of investment spending in S&B was largely
completed at the end of 2011.
Provisions increased $140 million, primarily due to builds in the
allowance for unfunded lending commitments as a result of portfolio growth
and higher net credit losses.
In millions of dollars 2012 2011 2010
S&B CVA/DVA
Fixed Income Markets $(2,047) $ 1,368 $(187)
Equity Markets (424) 355 (207)
Private Bank (16) 9 (5)
Total S&B CVA/DVA $(2,487) $ 1,732 $ (399)
S&B Hedges on Accrual
Loans gain (loss) (1) $ (698) $ 519 $ (65 )
(1) Hedges on S&B accrual loans reflect the mark-to-market on credit derivatives used to hedge the
corporate loan accrual portfolio. The fixed premium cost of these hedges is included (netted against)
the core lending revenues to reflect the cost of the credit protection.