Citibank 2012 Annual Report Download - page 252
Download and view the complete annual report
Please find page 252 of the 2012 Citibank annual report below. You can navigate through the pages in the report by either clicking on the pages listed below, or by using the keyword search tool below to find specific information within the annual report.-
 1
1 -
2
-
3
-
4
-
5
-
6
-
7
-
8
-
9
-
10
-
11
-
12
-
13
-
14
-
15
-
16
-
17
-
18
-
19
-
20
-
21
-
22
-
23
-
24
-
25
-
26
-
27
-
28
-
29
-
30
-
31
-
32
-
33
-
34
-
35
-
36
-
37
-
38
-
39
-
40
-
41
-
42
-
43
-
44
-
45
-
46
-
47
-
48
-
49
-
50
-
51
-
52
-
53
-
54
-
55
-
56
-
57
-
58
-
59
-
60
-
61
-
62
-
63
-
64
-
65
-
66
-
67
-
68
-
69
-
70
-
71
-
72
-
73
-
74
-
75
-
76
-
77
-
78
-
79
-
80
-
81
-
82
-
83
-
84
-
85
-
86
-
87
-
88
-
89
-
90
-
91
-
92
-
93
-
94
-
95
-
96
-
97
-
98
-
99
-
100
-
101
-
102
-
103
-
104
-
105
-
106
-
107
-
108
-
109
-
110
-
111
-
112
-
113
-
114
-
115
-
116
-
117
-
118
-
119
-
120
-
121
-
122
-
123
-
124
-
125
-
126
-
127
-
128
-
129
-
130
-
131
-
132
-
133
-
134
-
135
-
136
-
137
-
138
-
139
-
140
-
141
-
142
-
143
-
144
-
145
-
146
-
147
-
148
-
149
-
150
-
151
-
152
-
153
-
154
-
155
-
156
-
157
-
158
-
159
-
160
-
161
-
162
-
163
-
164
-
165
-
166
-
167
-
168
-
169
-
170
-
171
-
172
-
173
-
174
-
175
-
176
-
177
-
178
-
179
-
180
-
181
-
182
-
183
-
184
-
185
-
186
-
187
-
188
-
189
-
190
-
191
-
192
-
193
-
194
-
195
-
196
-
197
-
198
-
199
-
200
-
201
-
202
-
203
-
204
-
205
-
206
-
207
-
208
-
209
-
210
-
211
-
212
-
213
-
214
-
215
-
216
-
217
-
218
-
219
-
220
-
221
-
222
-
223
-
224
-
225
-
226
-
227
-
228
-
229
-
230
-
231
-
232
-
233
-
234
-
235
-
236
-
237
-
238
-
239
-
240
-
241
-
 242
242 -
 243
243 -
 244
244 -
 245
245 -
 246
246 -
 247
247 -
 248
248 -
 249
249 -
 250
250 -
 251
251 -
 252
252 -
 253
253 -
 254
254 -
 255
255 -
 256
256 -
 257
257 -
 258
258 -
 259
259 -
 260
260 -
 261
261 -
 262
262 -
263
-
264
-
265
-
266
-
267
-
268
-
269
-
270
-
271
-
272
-
273
-
274
-
275
-
276
-
277
-
278
-
279
-
280
-
281
-
282
-
283
-
284
-
285
-
286
-
287
-
288
-
289
-
290
-
291
-
292
-
293
-
294
-
295
-
296
-
297
-
298
-
299
-
300
-
301
-
302
-
303
-
304
-
305
-
306
-
307
-
308
-
309
-
310
-
311
-
312
-
313
-
314
-
315
-
316
-
317
-
318
-
319
-
320
-
321
-
322
-
323
-
324
 |
 |

230
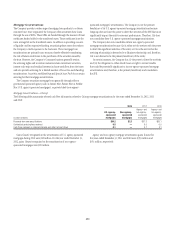
Mortgage Securitizations
The Company provides a wide range of mortgage loan products to a diverse
customer base. Once originated, the Company often securitizes these loans
through the use of SPEs. These SPEs are funded through the issuance of trust
certificates backed solely by the transferred assets. These certificates have the
same average life as the transferred assets. In addition to providing a source
of liquidity and less expensive funding, securitizing these assets also reduces
the Company’s credit exposure to the borrowers. These mortgage loan
securitizations are primarily non-recourse, thereby effectively transferring
the risk of future credit losses to the purchasers of the securities issued by
the trust. However, the Company’s Consumer business generally retains
the servicing rights and in certain instances retains investment securities,
interest-only strips and residual interests in future cash flows from the trusts
and also provides servicing for a limited number of Securities and Banking
securitizations. Securities and Banking and Special Asset Pool do not retain
servicing for their mortgage securitizations.
The Company securitizes mortgage loans generally through either a
government-sponsored agency, such as Ginnie Mae, Fannie Mae or Freddie
Mac (U.S. agency-sponsored mortgages), or private-label (non-agency-
sponsored mortgages) securitization. The Company is not the primary
beneficiary of its U.S. agency-sponsored mortgage securitizations because
Citigroup does not have the power to direct the activities of the SPE that most
significantly impact the entity’s economic performance. Therefore, Citi does
not consolidate these U.S. agency-sponsored mortgage securitizations.
The Company does not consolidate certain non-agency-sponsored
mortgage securitizations because Citi is either not the servicer with the power
to direct the significant activities of the entity or Citi is the servicer but the
servicing relationship is deemed to be a fiduciary relationship and, therefore,
Citi is not deemed to be the primary beneficiary of the entity.
In certain instances, the Company has (i) the power to direct the activities
and (ii) the obligation to either absorb losses or right to receive benefits
that could be potentially significant to its non-agency-sponsored mortgage
securitizations and, therefore, is the primary beneficiary and consolidates
the SPE.
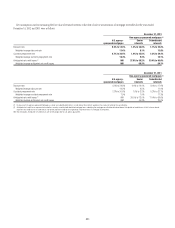
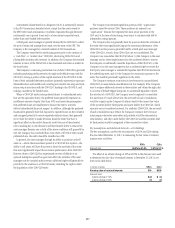
Mortgage Securitizations—Citicorp
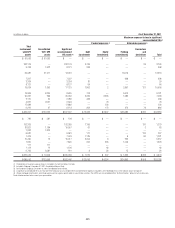
The following tables summarize selected cash flow information related to Citicorp mortgage securitizations for the years ended December 31, 2012, 2011
and 2010:
2012 2011 2010
In billions of dollars
U.S. agency-
sponsored
mortgages
Non-agency-
sponsored
mortgages
Agency- and
non-agency-
sponsored
mortgages
Agency- and
non-agency-
sponsored
mortgages
Proceeds from new securitizations $54.2 $2.3 $57.3 $65.1
Contractual servicing fees received 0.5 — 0.5 0.5
Cash flows received on retained interests and other net cash flows 0.1 — 0.1 0.1
Gains (losses) recognized on the securitization of U.S. agency-sponsored
mortgages during 2012 were $10 million. For the year ended December 31,
2012, gains (losses) recognized on the securitization of non-agency-
sponsored mortgages were $20 million.
Agency and non-agency mortgage securitization gains (losses) for
the years ended December 31, 2011 and 2010 were $(9) million and
$(5) million, respectively.