Citibank 2012 Annual Report Download - page 317
Download and view the complete annual report
Please find page 317 of the 2012 Citibank annual report below. You can navigate through the pages in the report by either clicking on the pages listed below, or by using the keyword search tool below to find specific information within the annual report.-
 1
1 -
2
-
3
-
4
-
5
-
6
-
7
-
8
-
9
-
10
-
11
-
12
-
13
-
14
-
15
-
16
-
17
-
18
-
19
-
20
-
21
-
22
-
23
-
24
-
25
-
26
-
27
-
28
-
29
-
30
-
31
-
32
-
33
-
34
-
35
-
36
-
37
-
38
-
39
-
40
-
41
-
42
-
43
-
44
-
45
-
46
-
47
-
48
-
49
-
50
-
51
-
52
-
53
-
54
-
55
-
56
-
57
-
58
-
59
-
60
-
61
-
62
-
63
-
64
-
65
-
66
-
67
-
68
-
69
-
70
-
71
-
72
-
73
-
74
-
75
-
76
-
77
-
78
-
79
-
80
-
81
-
82
-
83
-
84
-
85
-
86
-
87
-
88
-
89
-
90
-
91
-
92
-
93
-
94
-
95
-
96
-
97
-
98
-
99
-
100
-
101
-
102
-
103
-
104
-
105
-
106
-
107
-
108
-
109
-
110
-
111
-
112
-
113
-
114
-
115
-
116
-
117
-
118
-
119
-
120
-
121
-
122
-
123
-
124
-
125
-
126
-
127
-
128
-
129
-
130
-
131
-
132
-
133
-
134
-
135
-
136
-
137
-
138
-
139
-
140
-
141
-
142
-
143
-
144
-
145
-
146
-
147
-
148
-
149
-
150
-
151
-
152
-
153
-
154
-
155
-
156
-
157
-
158
-
159
-
160
-
161
-
162
-
163
-
164
-
165
-
166
-
167
-
168
-
169
-
170
-
171
-
172
-
173
-
174
-
175
-
176
-
177
-
178
-
179
-
180
-
181
-
182
-
183
-
184
-
185
-
186
-
187
-
188
-
189
-
190
-
191
-
192
-
193
-
194
-
195
-
196
-
197
-
198
-
199
-
200
-
201
-
202
-
203
-
204
-
205
-
206
-
207
-
208
-
209
-
210
-
211
-
212
-
213
-
214
-
215
-
216
-
217
-
218
-
219
-
220
-
221
-
222
-
223
-
224
-
225
-
226
-
227
-
228
-
229
-
230
-
231
-
232
-
233
-
234
-
235
-
236
-
237
-
238
-
239
-
240
-
241
-
242
-
243
-
244
-
245
-
246
-
247
-
248
-
249
-
250
-
251
-
252
-
253
-
254
-
255
-
256
-
257
-
258
-
259
-
260
-
261
-
262
-
263
-
264
-
265
-
266
-
267
-
268
-
269
-
270
-
271
-
272
-
273
-
274
-
275
-
276
-
277
-
278
-
279
-
280
-
281
-
282
-
283
-
284
-
285
-
286
-
287
-
288
-
289
-
290
-
291
-
292
-
293
-
294
-
295
-
296
-
297
-
298
-
299
-
300
-
301
-
302
-
303
-
304
-
305
-
306
-
 307
307 -
 308
308 -
 309
309 -
 310
310 -
 311
311 -
 312
312 -
 313
313 -
 314
314 -
 315
315 -
 316
316 -
 317
317 -
 318
318 -
 319
319 -
 320
320 -
 321
321 -
 322
322 -
 323
323 -
 324
324
 |
 |
295
Dividends
For a summary of the cash dividends paid on Citi’s outstanding common
stock during 2011 and 2012, see Note 29 to the Consolidated Financial
Statements. For as long as the FDIC continues to hold any Citigroup trust
preferred securities acquired pursuant to the exchange offers consummated
in 2009, Citigroup is generally restricted from paying regular cash dividends
in excess of $0.01 per share of common stock per quarter, which restriction
may be waived. Further, any dividend on Citi’s outstanding common
stock would need to be made in compliance with Citi’s obligations to any
remaining outstanding Citigroup preferred stock.
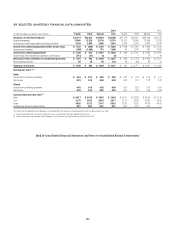
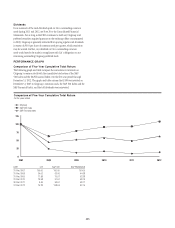
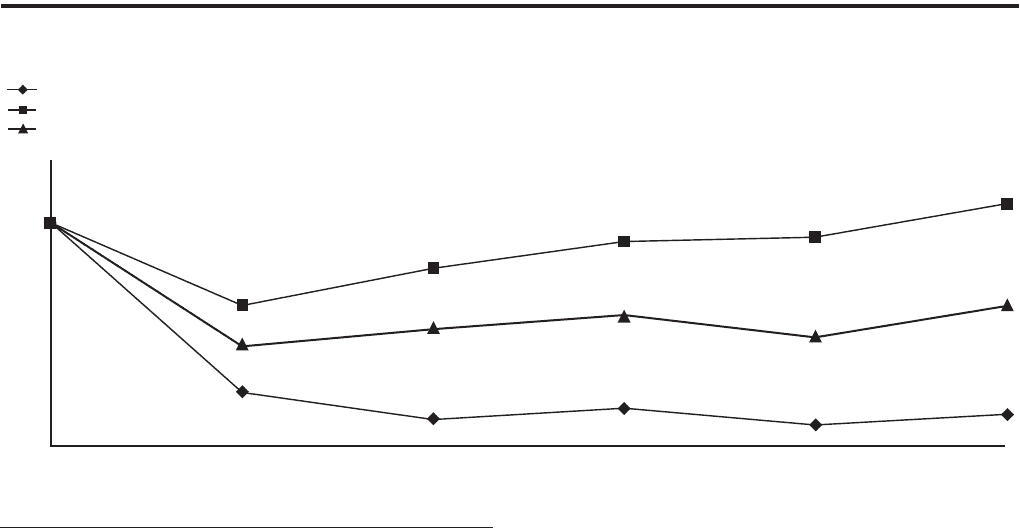
PERFORMANCE GRAPH
Comparison of Five-Year Cumulative Total Return
The following graph and table compare the cumulative total return on
Citigroup’s common stock with the cumulative total return of the S&P
500 Index and the S&P Financial Index over the five-year period through
December 31, 2012. The graph and table assume that $100 was invested on
December 31, 2007 in Citigroup’s common stock, the S&P 500 Index and the
S&P Financial Index, and that all dividends were reinvested.
0
25
50
75
100
125
Citigroup
S&P 500 Index
S&P Financial Index
Comparison of Five-Year Cumulative Total Return
For the years ended
20122007 2008 2009 2010 2011
DATE CITI S&P 500 S&P FINANCIALS
31-Dec-2007 100.00 100.00 100.00
31-Dec-2008 24.02 63.00 44.68
31-Dec-2009 11.88 79.67 52.38
31-Dec-2010 16.98 91.67 58.73
30-Dec-2011 9.45 93.61 48.71
31-Dec-2012 14.23 108.59 62.75