Citibank 2012 Annual Report Download - page 129
Download and view the complete annual report
Please find page 129 of the 2012 Citibank annual report below. You can navigate through the pages in the report by either clicking on the pages listed below, or by using the keyword search tool below to find specific information within the annual report.-
 1
1 -
2
-
3
-
4
-
5
-
6
-
7
-
8
-
9
-
10
-
11
-
12
-
13
-
14
-
15
-
16
-
17
-
18
-
19
-
20
-
21
-
22
-
23
-
24
-
25
-
26
-
27
-
28
-
29
-
30
-
31
-
32
-
33
-
34
-
35
-
36
-
37
-
38
-
39
-
40
-
41
-
42
-
43
-
44
-
45
-
46
-
47
-
48
-
49
-
50
-
51
-
52
-
53
-
54
-
55
-
56
-
57
-
58
-
59
-
60
-
61
-
62
-
63
-
64
-
65
-
66
-
67
-
68
-
69
-
70
-
71
-
72
-
73
-
74
-
75
-
76
-
77
-
78
-
79
-
80
-
81
-
82
-
83
-
84
-
85
-
86
-
87
-
88
-
89
-
90
-
91
-
92
-
93
-
94
-
95
-
96
-
97
-
98
-
99
-
100
-
101
-
102
-
103
-
104
-
105
-
106
-
107
-
108
-
109
-
110
-
111
-
112
-
113
-
114
-
115
-
116
-
117
-
118
-
 119
119 -
 120
120 -
 121
121 -
 122
122 -
 123
123 -
 124
124 -
 125
125 -
 126
126 -
 127
127 -
 128
128 -
 129
129 -
 130
130 -
 131
131 -
 132
132 -
 133
133 -
 134
134 -
 135
135 -
 136
136 -
 137
137 -
 138
138 -
 139
139 -
140
-
141
-
142
-
143
-
144
-
145
-
146
-
147
-
148
-
149
-
150
-
151
-
152
-
153
-
154
-
155
-
156
-
157
-
158
-
159
-
160
-
161
-
162
-
163
-
164
-
165
-
166
-
167
-
168
-
169
-
170
-
171
-
172
-
173
-
174
-
175
-
176
-
177
-
178
-
179
-
180
-
181
-
182
-
183
-
184
-
185
-
186
-
187
-
188
-
189
-
190
-
191
-
192
-
193
-
194
-
195
-
196
-
197
-
198
-
199
-
200
-
201
-
202
-
203
-
204
-
205
-
206
-
207
-
208
-
209
-
210
-
211
-
212
-
213
-
214
-
215
-
216
-
217
-
218
-
219
-
220
-
221
-
222
-
223
-
224
-
225
-
226
-
227
-
228
-
229
-
230
-
231
-
232
-
233
-
234
-
235
-
236
-
237
-
238
-
239
-
240
-
241
-
242
-
243
-
244
-
245
-
246
-
247
-
248
-
249
-
250
-
251
-
252
-
253
-
254
-
255
-
256
-
257
-
258
-
259
-
260
-
261
-
262
-
263
-
264
-
265
-
266
-
267
-
268
-
269
-
270
-
271
-
272
-
273
-
274
-
275
-
276
-
277
-
278
-
279
-
280
-
281
-
282
-
283
-
284
-
285
-
286
-
287
-
288
-
289
-
290
-
291
-
292
-
293
-
294
-
295
-
296
-
297
-
298
-
299
-
300
-
301
-
302
-
303
-
304
-
305
-
306
-
307
-
308
-
309
-
310
-
311
-
312
-
313
-
314
-
315
-
316
-
317
-
318
-
319
-
320
-
321
-
322
-
323
-
324
 |
 |

107
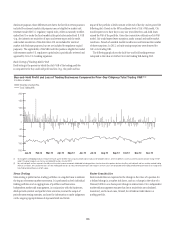
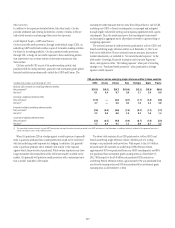
Average Rates
-
Interest Revenue, Interest Expense and Net Interest Margin
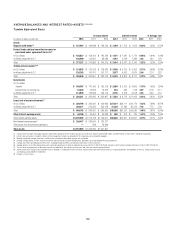
INTEREST REVENUE/EXPENSE AND YIELDS
Interest Revenue-Average Rate
Interest Expense-Average Rate
Net Interest Margin
1.34%
1.43%
1.51%
1.57%
1.59%
1.62%
1.69%
1.62%
1.60%
1.62%1.61%1.61%
3.32%
4.76% 4.59% 4.50% 4.36% 4.31% 4.29% 4.23% 4.26% 4.23% 4.07% 4.05% 4.04%
3.15% 3.06% 2.95% 2.88% 2.82% 2.83% 2.90% 2.90% 2.81% 2.86% 2.93%
1Q10 2Q10
2010: 3.12%
2011: 2.86% 2012: 2.88%
3Q10 4Q10 1Q11 2Q11 3Q11 4Q11 1Q12 2Q12 3Q12 4Q12
1.00%
1.50%
2.00%
2.50%
3.00%
3.50%
4.00%
4.50%
5.00%
5.50%
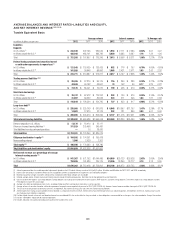
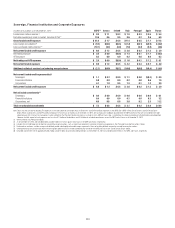
In millions of dollars, except as otherwise noted 2012 2011 2010
Change
2012 vs. 2011
Change
2011 vs. 2010
Interest revenue (1) $68,680 $73,201 $79,801 (6)% (8)%
Interest expense (2) 20,484 24,229 25,096 (15) (3)
Net interest revenue (3) $48,196 $48,972 $54,705 (2)% (10)%
Interest revenue—average rate 4.10% 4.27% 4.55% (17 ) bps (28) bps
Interest expense—average rate 1.46 1.63 1.61 (17) bps 2 bps
Net interest margin 2.88 2.86 3.12 2 bps (26) bps
Interest-rate benchmarks
Two-year U.S. Treasury note—average rate 0.28% 0.45% 0.70% (17) bps (25) bps
10-year U.S. Treasury note—average rate 1.80 2.78 3.21 (98) bps (43) bps
10-year vs. two-year spread 152 bps 233 bps 251 bps
(1) Interest revenue includes the taxable equivalent adjustments (based on the U.S. federal statutory tax rate of 35%) of $542 million, $520 million, and $519 million for 2012, 2011 and 2010, respectively.
(2) Interest expense includes the taxable equivalent adjustments (based on the U.S. federal statutory tax rate of 35%) of $51 million, $5 million and $0 million for 2012, 2011 and 2010, respectively.
(3) Excludes expenses associated with certain hybrid financial instruments. These obligations are classified as Long-term debt and accounted for at fair value with changes recorded in Principal transactions.
A significant portion of Citi’s business activities are based upon gathering
deposits and borrowing money and then lending or investing those funds,
or participating in market-making activities in tradable securities. Citi’s net
interest margin (NIM) is calculated by dividing gross interest revenue less
gross interest expense by average interest earning assets.
During 2012, Citi’s NIM remained relatively stable as compared to the
prior year at 288 basis points. Citi continued to experience pressure on its
loan and investment portfolio yields reflecting the low rate environment. In
aggregate, this pressure negatively impacted NIM by approximately 17 basis
points in 2012 versus the prior year. Ongoing pressure from the low rate
environment was offset by the pay-downs of higher-cost long-term debt and
redemptions of trust preferred securities during the year, which positively
impacted NIM by approximately 10 basis points in 2012. In addition, as
discussed under “Capital Resources and Liquidity—Funding and Liquidity”
above, during 2012, Citi reduced its deposit funding costs, partially through
increasing the share of non-interest bearing deposits, which contributed
approximately 10 basis points of NIM benefit in 2012. Decreased deposit costs
and lower outstanding long-term debt, as well as an increase in Citi’s trading
book portfolio yields, contributed to the increase in NIM quarter-over-quarter.
Absent any significant changes or events, Citi expects its NIM will likely
continue to reflect the pressure of a low interest rate environment and
subsequent changes in its portfolios, including its trading book portfolio,
although continued improvement in Citi’s cost of funds and lower levels of
outstanding long-term debt will both continue to positively impact NIM. As
such, Citi currently believes that its 2013 NIM should be relatively stable to its
full-year 2012 level, with some quarterly fluctuations.