Citibank 2012 Annual Report Download - page 108
Download and view the complete annual report
Please find page 108 of the 2012 Citibank annual report below. You can navigate through the pages in the report by either clicking on the pages listed below, or by using the keyword search tool below to find specific information within the annual report.-
 1
1 -
2
-
3
-
4
-
5
-
6
-
7
-
8
-
9
-
10
-
11
-
12
-
13
-
14
-
15
-
16
-
17
-
18
-
19
-
20
-
21
-
22
-
23
-
24
-
25
-
26
-
27
-
28
-
29
-
30
-
31
-
32
-
33
-
34
-
35
-
36
-
37
-
38
-
39
-
40
-
41
-
42
-
43
-
44
-
45
-
46
-
47
-
48
-
49
-
50
-
51
-
52
-
53
-
54
-
55
-
56
-
57
-
58
-
59
-
60
-
61
-
62
-
63
-
64
-
65
-
66
-
67
-
68
-
69
-
70
-
71
-
72
-
73
-
74
-
75
-
76
-
77
-
78
-
79
-
80
-
81
-
82
-
83
-
84
-
85
-
86
-
87
-
88
-
89
-
90
-
91
-
92
-
93
-
94
-
95
-
96
-
97
-
 98
98 -
 99
99 -
 100
100 -
 101
101 -
 102
102 -
 103
103 -
 104
104 -
 105
105 -
 106
106 -
 107
107 -
 108
108 -
 109
109 -
 110
110 -
 111
111 -
 112
112 -
 113
113 -
 114
114 -
 115
115 -
 116
116 -
 117
117 -
 118
118 -
119
-
120
-
121
-
122
-
123
-
124
-
125
-
126
-
127
-
128
-
129
-
130
-
131
-
132
-
133
-
134
-
135
-
136
-
137
-
138
-
139
-
140
-
141
-
142
-
143
-
144
-
145
-
146
-
147
-
148
-
149
-
150
-
151
-
152
-
153
-
154
-
155
-
156
-
157
-
158
-
159
-
160
-
161
-
162
-
163
-
164
-
165
-
166
-
167
-
168
-
169
-
170
-
171
-
172
-
173
-
174
-
175
-
176
-
177
-
178
-
179
-
180
-
181
-
182
-
183
-
184
-
185
-
186
-
187
-
188
-
189
-
190
-
191
-
192
-
193
-
194
-
195
-
196
-
197
-
198
-
199
-
200
-
201
-
202
-
203
-
204
-
205
-
206
-
207
-
208
-
209
-
210
-
211
-
212
-
213
-
214
-
215
-
216
-
217
-
218
-
219
-
220
-
221
-
222
-
223
-
224
-
225
-
226
-
227
-
228
-
229
-
230
-
231
-
232
-
233
-
234
-
235
-
236
-
237
-
238
-
239
-
240
-
241
-
242
-
243
-
244
-
245
-
246
-
247
-
248
-
249
-
250
-
251
-
252
-
253
-
254
-
255
-
256
-
257
-
258
-
259
-
260
-
261
-
262
-
263
-
264
-
265
-
266
-
267
-
268
-
269
-
270
-
271
-
272
-
273
-
274
-
275
-
276
-
277
-
278
-
279
-
280
-
281
-
282
-
283
-
284
-
285
-
286
-
287
-
288
-
289
-
290
-
291
-
292
-
293
-
294
-
295
-
296
-
297
-
298
-
299
-
300
-
301
-
302
-
303
-
304
-
305
-
306
-
307
-
308
-
309
-
310
-
311
-
312
-
313
-
314
-
315
-
316
-
317
-
318
-
319
-
320
-
321
-
322
-
323
-
324
 |
 |

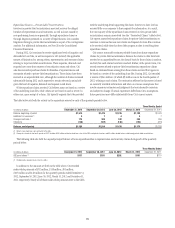
86
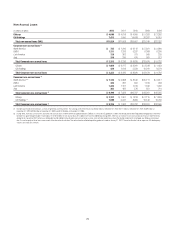
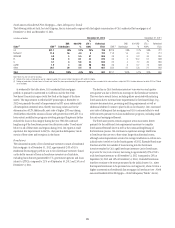
North America Residential First Mortgages—State Delinquency Trends
The following tables set forth, for total Citigroup, the six states and/or regions with the highest concentration of Citi’s residential first mortgages as of
December 31, 2012 and December 31, 2011.
In billions of dollars December 31, 2012 December 31, 2011
State (1) ENR (2)
ENR
Distribution
90+DPD
%
%
LTV >
100%
Refreshed
FICO ENR (2)
ENR
Distribution
90+DPD
%
%
LTV >
100%
Refreshed
FICO
CA $21.1 28% 2.1% 23% 730 $22.6 28% 2.7% 38% 727
NY/NJ/CT 11.8 16 4.0 8 723 11.2 14 4.9 10 712
IN/OH/MI 4.0 5 5.5 31 655 4.6 6 6.3 44 650
FL 3.8 5 8.1 43 676 4.3 5 10.2 57 668
IL 3.1 4 5.8 34 694 3.5 4 7.2 45 686
AZ/NV 1.9 3 4.8 50 702 2.3 3 5.7 73 698
Other 29.7 39 5.4 15 667 33.2 41 5.8 21 663
Total $75.4 100% 4.4% 20% 692 $81.7 100% 5.1% 30% 689
Note: Totals may not sum due to rounding.
(1) Certain of the states are included as part of a region based on Citi’s view of similar home prices (HPI) within the region.
(2) Ending net receivables. Excludes loans in Canada and Puerto Rico, loans guaranteed by U.S. government agencies, loans recorded at fair value and loans subject to LTSCs. Excludes balances for which FICO or LTV data
are unavailable.
As evidenced by the table above, Citi’s residential first mortgages
portfolio is primarily concentrated in California and the New York/
New Jersey/Connecticut region (with New York as the largest of the three
states). The improvement in refreshed LTV percentages at December 31,
2012 was primarily the result of improvements in HPI across substantially
all metropolitan statistical areas, thereby increasing values used in the
determination of LTV. Additionally, asset sales of higher LTV loans during
2012 further reduced the amount of loans with greater than 100% LTV. To a
lesser extent, modification programs involving principal forgiveness further
reduced the loans in this category during the year. With the continued
lengthening of the foreclosure process (see discussion under “Foreclosures”
below) in all of these states and regions during 2012, Citi expects it could
experience less improvement in the 90+ days past due delinquency rate in
certain of these states and/or regions in the future.
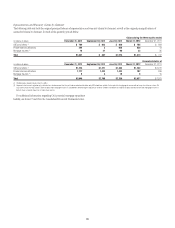
Foreclosures
The substantial majority of Citi’s foreclosure inventory consists of residential
first mortgages. As of December 31, 2012, approximately 2.0% of Citi’s
residential first mortgage portfolio was in Citi’s foreclosure inventory (based
on the dollar amount of loans in foreclosure inventory as of such date,
excluding loans that are guaranteed by U.S. government agencies and loans
subject to LTSCs), compared to 2.1% as of September 30, 2012 and 2.4% as of
December 31, 2011.
The decline in Citi’s foreclosure inventory year-over-year and quarter-
over-quarter was due to fewer loans moving into the foreclosure inventory.
This was due to several factors, including delays associated with initiating
foreclosures due to increased state requirements for foreclosure filings (e.g.,
extensive documentation, processing and filing requirements as well as
additional abilities for states to place holds on foreclosures), Citi’s continued
asset sales of delinquent first mortgages and Citi’s continued efforts to work
with borrowers pursuant to its loan modification programs, including under
the national mortgage settlement.
The foreclosure process remains stagnant across most states, driven
primarily by the additional state requirements necessary to complete
foreclosures referenced above as well as the continued lengthening of
the foreclosure process. Citi continues to experience average timeframes
to foreclosure that are two to three times longer than historical norms,
although some improvement occurred in average timeframes in certain non-
judicial states (see below) in the fourth quarter of 2012. Extended foreclosure
timelines and the low number of loans moving into the foreclosure
inventory resulted in Citi’s aged foreclosure inventory (active foreclosures
in process for two years or more) increasing to approximately 29% of Citi’s
total foreclosure inventory as of December 31, 2012 (compared to 20% at
September 30, 2012 and 10% at December 31, 2011). Extended foreclosure
timelines continue to be more pronounced in the judicial states (i.e., states
that require foreclosures to be processed via court approval), where Citi has a
higher concentration of residential first mortgages in foreclosure (see “North
America Residential First Mortgages—State Delinquency Trends” above).