Citibank 2012 Annual Report Download - page 54
Download and view the complete annual report
Please find page 54 of the 2012 Citibank annual report below. You can navigate through the pages in the report by either clicking on the pages listed below, or by using the keyword search tool below to find specific information within the annual report.-
 1
1 -
2
-
3
-
4
-
5
-
6
-
7
-
8
-
9
-
10
-
11
-
12
-
13
-
14
-
15
-
16
-
17
-
18
-
19
-
20
-
21
-
22
-
23
-
24
-
25
-
26
-
27
-
28
-
29
-
30
-
31
-
32
-
33
-
34
-
35
-
36
-
37
-
38
-
39
-
40
-
41
-
42
-
43
-
 44
44 -
 45
45 -
 46
46 -
 47
47 -
 48
48 -
 49
49 -
 50
50 -
 51
51 -
 52
52 -
 53
53 -
 54
54 -
 55
55 -
 56
56 -
 57
57 -
 58
58 -
 59
59 -
 60
60 -
 61
61 -
 62
62 -
 63
63 -
 64
64 -
65
-
66
-
67
-
68
-
69
-
70
-
71
-
72
-
73
-
74
-
75
-
76
-
77
-
78
-
79
-
80
-
81
-
82
-
83
-
84
-
85
-
86
-
87
-
88
-
89
-
90
-
91
-
92
-
93
-
94
-
95
-
96
-
97
-
98
-
99
-
100
-
101
-
102
-
103
-
104
-
105
-
106
-
107
-
108
-
109
-
110
-
111
-
112
-
113
-
114
-
115
-
116
-
117
-
118
-
119
-
120
-
121
-
122
-
123
-
124
-
125
-
126
-
127
-
128
-
129
-
130
-
131
-
132
-
133
-
134
-
135
-
136
-
137
-
138
-
139
-
140
-
141
-
142
-
143
-
144
-
145
-
146
-
147
-
148
-
149
-
150
-
151
-
152
-
153
-
154
-
155
-
156
-
157
-
158
-
159
-
160
-
161
-
162
-
163
-
164
-
165
-
166
-
167
-
168
-
169
-
170
-
171
-
172
-
173
-
174
-
175
-
176
-
177
-
178
-
179
-
180
-
181
-
182
-
183
-
184
-
185
-
186
-
187
-
188
-
189
-
190
-
191
-
192
-
193
-
194
-
195
-
196
-
197
-
198
-
199
-
200
-
201
-
202
-
203
-
204
-
205
-
206
-
207
-
208
-
209
-
210
-
211
-
212
-
213
-
214
-
215
-
216
-
217
-
218
-
219
-
220
-
221
-
222
-
223
-
224
-
225
-
226
-
227
-
228
-
229
-
230
-
231
-
232
-
233
-
234
-
235
-
236
-
237
-
238
-
239
-
240
-
241
-
242
-
243
-
244
-
245
-
246
-
247
-
248
-
249
-
250
-
251
-
252
-
253
-
254
-
255
-
256
-
257
-
258
-
259
-
260
-
261
-
262
-
263
-
264
-
265
-
266
-
267
-
268
-
269
-
270
-
271
-
272
-
273
-
274
-
275
-
276
-
277
-
278
-
279
-
280
-
281
-
282
-
283
-
284
-
285
-
286
-
287
-
288
-
289
-
290
-
291
-
292
-
293
-
294
-
295
-
296
-
297
-
298
-
299
-
300
-
301
-
302
-
303
-
304
-
305
-
306
-
307
-
308
-
309
-
310
-
311
-
312
-
313
-
314
-
315
-
316
-
317
-
318
-
319
-
320
-
321
-
322
-
323
-
324
 |
 |

32
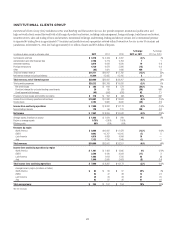
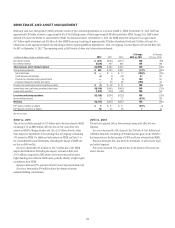
BROKERAGE AND ASSET MANAGEMENT
Brokerage and Asset Management (BAM) primarily consists of Citi’s remaining investment in, and assets related to, MSSB. At December 31, 2012, BAM had
approximately $9 billion of assets, or approximately 6% of Citi Holdings assets, of which approximately $8 billion related to MSSB. During 2012, BAM’s assets
declined 67% due to the decline in assets related to MSSB (see discussion below). At December 31, 2012, the MSSB assets were composed of an approximate
$4.7 billion equity investment and $3 billion of other MSSB financing (consisting of approximately $2 billion of preferred stock and $1 billion of loans). For
information on the agreement entered into with Morgan Stanley regarding MSSB on September 11, 2012, see Citigroup’s Current Report on Form 8-K filed with
the SEC on September 11, 2012. The remaining assets in BAM consist of other retail alternative investments.
In millions of dollars, except as otherwise noted 2012 2011 2010
% Change
2012 vs. 2011
% Change
2011 vs. 2010
Net interest revenue $ (471) $(180) $(277) NM 35%
Non-interest revenue (4,228) 462 886 NM (48)
Total revenues, net of interest expense $(4,699) $ 282 $ 609 NM (54)%
Total operating expenses $ 462 $ 729 $ 987 (37)% (26)%
Net credit losses $ — $ 4 $ 17 (100)% (76)%
Credit reserve build (release) (1) (3) (18) 67 83
Provision for unfunded lending commitments —(1) (6) 100 83
Provision (release) for benefits and claims —48 38 (100) 26
Provisions for credit losses and for benefits and claims $ (1) $ 48 $ 31 NM 55%
Income (loss) from continuing operations before taxes $(5,160) $(495) $(409) NM (21)%
Income taxes (benefits) (1,970) (209) (183) NM (14)
Loss from continuing operations $(3,190) $(286) $(226) NM (27)%
Noncontrolling interests 39 11 (67)% (18)
Net (loss) $(3,193) $(295) $(237) NM (24)%
EOP assets (in billions of dollars) $ 9 $ 27 $ 27 (67)% —%
EOP deposits (in billions of dollars) 59 55 58 7(5)
NM Not meaningful
2012 vs. 2011
The net loss in BAM increased by $2.9 billion due to the loss related to MSSB,
consisting of (i) an $800 million after-tax loss on Citi’s sale of the 14%
interest in MSSB to Morgan Stanley and (ii) a $2.1 billion after-tax other-
than-temporary impairment of the carrying value of Citigroup’s remaining
35% interest in MSSB. For additional information on MSSB, see Note 15 to
the Consolidated Financial Statements. Excluding the impact of MSSB, the
net loss in BAM was flat.
Revenues decreased by $5.0 billion to $(4.7) billion due to the MSSB
impact described above. Excluding this impact, revenues in BAM were
$(15) million, compared to $282 million in the prior-year period, due to
higher funding costs related to MSSB assets, partially offset by a higher equity
contribution from MSSB.
Expenses decreased 37%, primarily driven by lower legal and related costs.
Provisions decreased by $49 million due to the absence of certain
unfunded lending commitments.
2011 vs. 2010
The net loss increased 24% as lower revenues were partly offset by lower
expenses.
Revenues decreased by 54%, driven by the 2010 sale of Citi’s Habitat and
Colfondos businesses (including a $78 million pretax gain on sale related to
the transactions in the first quarter of 2010) and lower revenues from MSSB.
Expenses decreased 26%, also driven by divestitures, as well as lower legal
and related expenses.
Provisions increased 55%, primarily due to the absence of the prior-year
reserve releases.