Citibank 2012 Annual Report Download - page 214
Download and view the complete annual report
Please find page 214 of the 2012 Citibank annual report below. You can navigate through the pages in the report by either clicking on the pages listed below, or by using the keyword search tool below to find specific information within the annual report.-
 1
1 -
2
-
3
-
4
-
5
-
6
-
7
-
8
-
9
-
10
-
11
-
12
-
13
-
14
-
15
-
16
-
17
-
18
-
19
-
20
-
21
-
22
-
23
-
24
-
25
-
26
-
27
-
28
-
29
-
30
-
31
-
32
-
33
-
34
-
35
-
36
-
37
-
38
-
39
-
40
-
41
-
42
-
43
-
44
-
45
-
46
-
47
-
48
-
49
-
50
-
51
-
52
-
53
-
54
-
55
-
56
-
57
-
58
-
59
-
60
-
61
-
62
-
63
-
64
-
65
-
66
-
67
-
68
-
69
-
70
-
71
-
72
-
73
-
74
-
75
-
76
-
77
-
78
-
79
-
80
-
81
-
82
-
83
-
84
-
85
-
86
-
87
-
88
-
89
-
90
-
91
-
92
-
93
-
94
-
95
-
96
-
97
-
98
-
99
-
100
-
101
-
102
-
103
-
104
-
105
-
106
-
107
-
108
-
109
-
110
-
111
-
112
-
113
-
114
-
115
-
116
-
117
-
118
-
119
-
120
-
121
-
122
-
123
-
124
-
125
-
126
-
127
-
128
-
129
-
130
-
131
-
132
-
133
-
134
-
135
-
136
-
137
-
138
-
139
-
140
-
141
-
142
-
143
-
144
-
145
-
146
-
147
-
148
-
149
-
150
-
151
-
152
-
153
-
154
-
155
-
156
-
157
-
158
-
159
-
160
-
161
-
162
-
163
-
164
-
165
-
166
-
167
-
168
-
169
-
170
-
171
-
172
-
173
-
174
-
175
-
176
-
177
-
178
-
179
-
180
-
181
-
182
-
183
-
184
-
185
-
186
-
187
-
188
-
189
-
190
-
191
-
192
-
193
-
194
-
195
-
196
-
197
-
198
-
199
-
200
-
201
-
202
-
203
-
 204
204 -
 205
205 -
 206
206 -
 207
207 -
 208
208 -
 209
209 -
 210
210 -
 211
211 -
 212
212 -
 213
213 -
 214
214 -
 215
215 -
 216
216 -
 217
217 -
 218
218 -
 219
219 -
 220
220 -
 221
221 -
 222
222 -
 223
223 -
 224
224 -
225
-
226
-
227
-
228
-
229
-
230
-
231
-
232
-
233
-
234
-
235
-
236
-
237
-
238
-
239
-
240
-
241
-
242
-
243
-
244
-
245
-
246
-
247
-
248
-
249
-
250
-
251
-
252
-
253
-
254
-
255
-
256
-
257
-
258
-
259
-
260
-
261
-
262
-
263
-
264
-
265
-
266
-
267
-
268
-
269
-
270
-
271
-
272
-
273
-
274
-
275
-
276
-
277
-
278
-
279
-
280
-
281
-
282
-
283
-
284
-
285
-
286
-
287
-
288
-
289
-
290
-
291
-
292
-
293
-
294
-
295
-
296
-
297
-
298
-
299
-
300
-
301
-
302
-
303
-
304
-
305
-
306
-
307
-
308
-
309
-
310
-
311
-
312
-
313
-
314
-
315
-
316
-
317
-
318
-
319
-
320
-
321
-
322
-
323
-
324
 |
 |

192
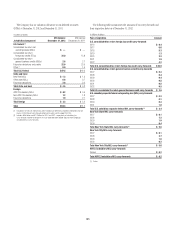
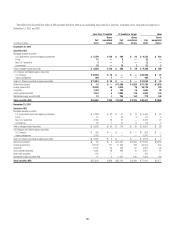
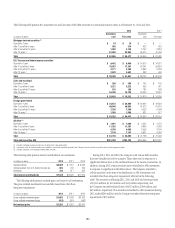
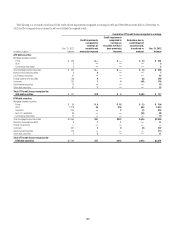
The following table presents the amortized cost and fair value of AFS debt securities by contractual maturity dates as of December 31, 2012 and 2011:
2012 2011
In millions of dollars
Amortized
cost Fair value
Amortized
cost Fair value
Mortgage-backed securities (1)
Due within 1 year $ 10 $ 10 $ — $ —
After 1 but within 5 years 365 374 422 423
After 5 but within 10 years 1,992 2,124 2,757 2,834
After 10 years (2) 51,598 52,963 46,470 47,768
Total $ 53,965 $ 55,471 $ 49,649 $ 51,025
U.S. Treasury and federal agency securities
Due within 1 year $ 9,492 $ 9,499 $ 14,615 $ 14,637
After 1 but within 5 years 75,967 77,267 62,241 63,823
After 5 but within 10 years 2,171 2,408 5,862 6,239
After 10 years (2) 2,670 2,667 382 439
Total $ 90,300 $ 91,841 $ 83,100 $ 85,138
State and municipal
Due within 1 year $ 208 $ 208 $ 142 $ 142
After 1 but within 5 years 3,221 3,223 455 457
After 5 but within 10 years 155 165 182 188
After 10 years (2) 16,436 14,736 16,040 13,612
Total $ 20,020 $ 18,332 $ 16,819 $ 14,399
Foreign government
Due within 1 year $ 34,873 $ 34,869 $ 34,924 $ 34,864
After 1 but within 5 years 49,548 49,933 41,612 41,675
After 5 but within 10 years 7,239 7,380 6,993 6,998
After 10 years (2) 1,599 1,865 831 977
Total $ 93,259 $ 94,047 $ 84,360 $ 84,514
All other (3)
Due within 1 year $ 1,001 $ 1,009 $ 4,055 $ 4,072
After 1 but within 5 years 11,285 11,351 9,843 9,928
After 5 but within 10 years 4,330 4,505 3,009 3,160
After 10 years (2) 7,130 7,197 4,821 4,783
Total $ 23,746 $ 24,062 $ 21,728 $ 21,943
Total debt securities AFS $281,290 $283,753 $255,656 $257,019
(1) Includes mortgage-backed securities of U.S. government-sponsored entities.
(2) Investments with no stated maturities are included as contractual maturities of greater than 10 years. Actual maturities may differ due to call or prepayment rights.
(3) Includes corporate, asset-backed and other debt securities.
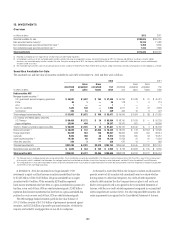
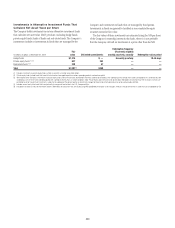
The following table presents interest and dividends on investments:
In millions of dollars 2012 2011 2010
Taxable interest $ 6,509 $ 7,257 $ 9,922
Interest exempt from U.S. federal income tax 683 746 760
Dividends 333 317 322
Total interest and dividends $ 7,525 $ 8,320 $11,004
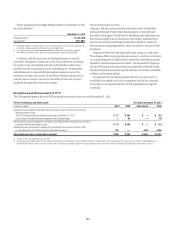
The following table presents realized gains and losses on all investments.
The gross realized investment losses exclude losses from other-than-
temporary impairment:
In millions of dollars 2012 2011 2010
Gross realized investment gains $3,663 $ 2,498 $ 2,873
Gross realized investment losses (412) (501) (462)
Net realized gains $3,251 $ 1,997 $ 2,411
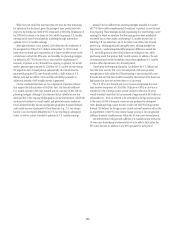
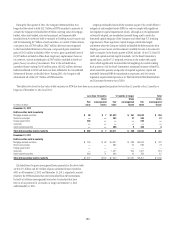
During 2012, 2011 and 2010, the Company sold various debt securities
that were classified as held-to-maturity. These sales were in response to a
significant deterioration in the creditworthiness of the issuers or securities. In
addition, during 2012 certain securities were reclassified to AFS investments
in response to significant credit deterioration. The Company intended to
sell the securities at the time of reclassification to AFS investments and
recorded other-than-temporary impairment reflected in the following
table. The securities sold during 2012, 2011 and 2010 had carrying values
of $2,110 million, $1,612 million and $413 million respectively, and
the Company recorded realized losses of $187 million, $299 million and
$49 million, respectively. The securities reclassified to AFS investments during
2012 totaled $244 million and the Company recorded other-than-temporary
impairment of $59 million.