Citibank 2012 Annual Report Download - page 282
Download and view the complete annual report
Please find page 282 of the 2012 Citibank annual report below. You can navigate through the pages in the report by either clicking on the pages listed below, or by using the keyword search tool below to find specific information within the annual report.-
 1
1 -
2
-
3
-
4
-
5
-
6
-
7
-
8
-
9
-
10
-
11
-
12
-
13
-
14
-
15
-
16
-
17
-
18
-
19
-
20
-
21
-
22
-
23
-
24
-
25
-
26
-
27
-
28
-
29
-
30
-
31
-
32
-
33
-
34
-
35
-
36
-
37
-
38
-
39
-
40
-
41
-
42
-
43
-
44
-
45
-
46
-
47
-
48
-
49
-
50
-
51
-
52
-
53
-
54
-
55
-
56
-
57
-
58
-
59
-
60
-
61
-
62
-
63
-
64
-
65
-
66
-
67
-
68
-
69
-
70
-
71
-
72
-
73
-
74
-
75
-
76
-
77
-
78
-
79
-
80
-
81
-
82
-
83
-
84
-
85
-
86
-
87
-
88
-
89
-
90
-
91
-
92
-
93
-
94
-
95
-
96
-
97
-
98
-
99
-
100
-
101
-
102
-
103
-
104
-
105
-
106
-
107
-
108
-
109
-
110
-
111
-
112
-
113
-
114
-
115
-
116
-
117
-
118
-
119
-
120
-
121
-
122
-
123
-
124
-
125
-
126
-
127
-
128
-
129
-
130
-
131
-
132
-
133
-
134
-
135
-
136
-
137
-
138
-
139
-
140
-
141
-
142
-
143
-
144
-
145
-
146
-
147
-
148
-
149
-
150
-
151
-
152
-
153
-
154
-
155
-
156
-
157
-
158
-
159
-
160
-
161
-
162
-
163
-
164
-
165
-
166
-
167
-
168
-
169
-
170
-
171
-
172
-
173
-
174
-
175
-
176
-
177
-
178
-
179
-
180
-
181
-
182
-
183
-
184
-
185
-
186
-
187
-
188
-
189
-
190
-
191
-
192
-
193
-
194
-
195
-
196
-
197
-
198
-
199
-
200
-
201
-
202
-
203
-
204
-
205
-
206
-
207
-
208
-
209
-
210
-
211
-
212
-
213
-
214
-
215
-
216
-
217
-
218
-
219
-
220
-
221
-
222
-
223
-
224
-
225
-
226
-
227
-
228
-
229
-
230
-
231
-
232
-
233
-
234
-
235
-
236
-
237
-
238
-
239
-
240
-
241
-
242
-
243
-
244
-
245
-
246
-
247
-
248
-
249
-
250
-
251
-
252
-
253
-
254
-
255
-
256
-
257
-
258
-
259
-
260
-
261
-
262
-
263
-
264
-
265
-
266
-
267
-
268
-
269
-
270
-
271
-
 272
272 -
 273
273 -
 274
274 -
 275
275 -
 276
276 -
 277
277 -
 278
278 -
 279
279 -
 280
280 -
 281
281 -
 282
282 -
 283
283 -
 284
284 -
 285
285 -
 286
286 -
 287
287 -
 288
288 -
 289
289 -
 290
290 -
 291
291 -
 292
292 -
293
-
294
-
295
-
296
-
297
-
298
-
299
-
300
-
301
-
302
-
303
-
304
-
305
-
306
-
307
-
308
-
309
-
310
-
311
-
312
-
313
-
314
-
315
-
316
-
317
-
318
-
319
-
320
-
321
-
322
-
323
-
324
 |
 |

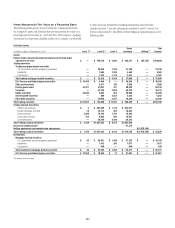
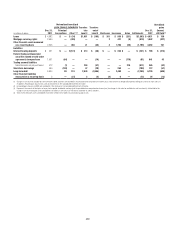
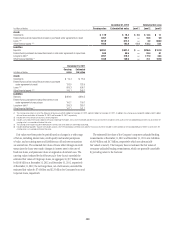
260
Net realized/unrealized
gains (losses) included in Transfers
into and/or
out of
Level 3
Dec. 31,
2011
Unrealized
gains
(losses)
still held
In millions of dollars
Dec. 31,
2010
Principal
transactions Other (1)(2) Purchases Issuances Sales Settlements (3)
Assets
Federal funds sold and securities
borrowed or purchased under
agreements to resell $4,911 $ 90 $ — $ (300) $ — $ — $ — $ — $ 4,701 $ 89
Trading securities
Trading mortgage-backed securities
U.S. government-sponsored agency
guaranteed $ 831 $ (62) $ — $ 169 $ 677 $ 73 $ (686) $ (141) $ 861 $ (100)
Residential 2,328 148 — (138) 4,150 — (4,901) (78) 1,509 118
Commercial 418 33 — 345 418 — (570) (26) 618 (57)
Total trading mortgage-backed
securities $ 3,577 $ 119 $ — $ 376 $ 5,245 $ 73 $ (6,157) $ (245) $ 2,988 $ (39)
U.S. Treasury and federal
agencies securities $ 72 $ 9 $ — $ (45) $ 8 $ — $ (41) $ — $ 3 $ —
State and municipal $ 208 $ 67 $ — $ 102 $ 1,128 $ — $ (1,243) $ (10) $ 252 $ (35)
Foreign government 566 (33) — (243) 1,556 — (797) (528) 521 (22)
Corporate 5,004 (60) — 1,452 3,272 — (3,864) (2,564) 3,240 (680)
Equity securities 776 (202) — (145) 191 — (376) — 244 (143)
Asset-backed securities 7,620 128 — 606 5,198 — (6,069) (1,682) 5,801 (779)
Other debt securities 1,833 (179) — (17) 2,810 — (1,700) (4) 2,743 68
Total trading securities $19,656 $ (151) $ — $ 2,086 $19,408 $ 73 $ (20,247) $ (5,033) $15,792 $ (1,630)
Trading derivatives, net (4)
Interest rate contracts $ (730) $ (242) $ — $ 1,549 $ 111 $ — $ (21) $ 59 $ 726 $ 52
Foreign exchange contracts (336) (134) — (62) 11 — (3) (38) (562) (100)
Equity contracts (1,639) 471 — (28) 362 — (242) (661) (1,737) (1,139)
Commodity contracts (1,023) 426 — (83) 2 — (104) (152) (934) (48)
Credit derivatives 2,296 520 — 183 8 — (1) (1,278) 1,728 1,615
Total trading derivatives, net (4) $ (1,432) $ 1,041 $ — $ 1,559 $ 494 $ — $ (371) $(2,070) $ (779) $ 380
Investments
Mortgage-backed securities
U.S. government-sponsored agency
guaranteed $ 22 $ — $ (22) $ 416 $ 270 $ — $ (7) $ — $ 679 $ (38)
Residential 167 — (2) (109) 7 — (54) (1) 8 —
Commercial 527 — (4) (513) 42 — (52) — — —
Total investment mortgage-backed
securities $ 716 $ — $ (28) $ (206) $ 319 $ — $ (113) $ (1) $ 687 $ (38)
U.S. Treasury and federal agencies
securities $ 17 $ — $ — $ 60 $ — $ — $ (2) $ — $ 75 $ —
State and municipal 504 — (10) (59) 324 — (92) — 667 (20)
Foreign government 358 — 13 (21) 352 — (67) (188) 447 6
Corporate 525 — (106) 199 732 — (56) (305) 989 6
Equity securities 2,055 — (38) (31) — — (84) (449) 1,453 —
Asset-backed securities 5,424 — 43 55 106 — (460) (1,127) 4,041 5
Other debt securities 727 — 26 121 35 — (289) (500) 120 (2)
Non-marketable equity securities 6,960 — 862 (886) 4,881 — (1,838) (1,661) 8,318 580
Total investments $17,286 $ — $ 762 $ (768) $ 6,749 $ — $ (3,001) $(4,231) $16,797 $ 537