Citibank 2012 Annual Report Download - page 238
Download and view the complete annual report
Please find page 238 of the 2012 Citibank annual report below. You can navigate through the pages in the report by either clicking on the pages listed below, or by using the keyword search tool below to find specific information within the annual report.-
 1
1 -
2
-
3
-
4
-
5
-
6
-
7
-
8
-
9
-
10
-
11
-
12
-
13
-
14
-
15
-
16
-
17
-
18
-
19
-
20
-
21
-
22
-
23
-
24
-
25
-
26
-
27
-
28
-
29
-
30
-
31
-
32
-
33
-
34
-
35
-
36
-
37
-
38
-
39
-
40
-
41
-
42
-
43
-
44
-
45
-
46
-
47
-
48
-
49
-
50
-
51
-
52
-
53
-
54
-
55
-
56
-
57
-
58
-
59
-
60
-
61
-
62
-
63
-
64
-
65
-
66
-
67
-
68
-
69
-
70
-
71
-
72
-
73
-
74
-
75
-
76
-
77
-
78
-
79
-
80
-
81
-
82
-
83
-
84
-
85
-
86
-
87
-
88
-
89
-
90
-
91
-
92
-
93
-
94
-
95
-
96
-
97
-
98
-
99
-
100
-
101
-
102
-
103
-
104
-
105
-
106
-
107
-
108
-
109
-
110
-
111
-
112
-
113
-
114
-
115
-
116
-
117
-
118
-
119
-
120
-
121
-
122
-
123
-
124
-
125
-
126
-
127
-
128
-
129
-
130
-
131
-
132
-
133
-
134
-
135
-
136
-
137
-
138
-
139
-
140
-
141
-
142
-
143
-
144
-
145
-
146
-
147
-
148
-
149
-
150
-
151
-
152
-
153
-
154
-
155
-
156
-
157
-
158
-
159
-
160
-
161
-
162
-
163
-
164
-
165
-
166
-
167
-
168
-
169
-
170
-
171
-
172
-
173
-
174
-
175
-
176
-
177
-
178
-
179
-
180
-
181
-
182
-
183
-
184
-
185
-
186
-
187
-
188
-
189
-
190
-
191
-
192
-
193
-
194
-
195
-
196
-
197
-
198
-
199
-
200
-
201
-
202
-
203
-
204
-
205
-
206
-
207
-
208
-
209
-
210
-
211
-
212
-
213
-
214
-
215
-
216
-
217
-
218
-
219
-
220
-
221
-
222
-
223
-
224
-
225
-
226
-
227
-
 228
228 -
 229
229 -
 230
230 -
 231
231 -
 232
232 -
 233
233 -
 234
234 -
 235
235 -
 236
236 -
 237
237 -
 238
238 -
 239
239 -
 240
240 -
 241
241 -
 242
242 -
 243
243 -
 244
244 -
 245
245 -
 246
246 -
 247
247 -
 248
248 -
249
-
250
-
251
-
252
-
253
-
254
-
255
-
256
-
257
-
258
-
259
-
260
-
261
-
262
-
263
-
264
-
265
-
266
-
267
-
268
-
269
-
270
-
271
-
272
-
273
-
274
-
275
-
276
-
277
-
278
-
279
-
280
-
281
-
282
-
283
-
284
-
285
-
286
-
287
-
288
-
289
-
290
-
291
-
292
-
293
-
294
-
295
-
296
-
297
-
298
-
299
-
300
-
301
-
302
-
303
-
304
-
305
-
306
-
307
-
308
-
309
-
310
-
311
-
312
-
313
-
314
-
315
-
316
-
317
-
318
-
319
-
320
-
321
-
322
-
323
-
324
 |
 |

216
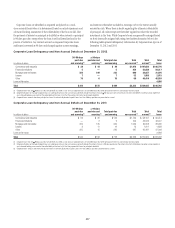
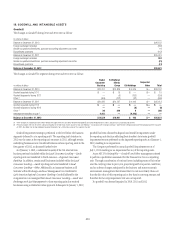
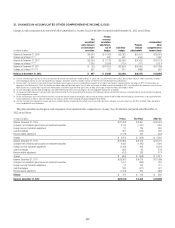
INTANGIBLE ASSETS
The components of intangible assets were as follows:
December 31, 2012 December 31, 2011
In millions of dollars
Gross
carrying
amount
Accumulated
amortization
Net
carrying
amount
Gross
carrying
amount
Accumulated
amortization
Net
carrying
amount
Purchased credit card relationships $ 7,632 $ 5,726 $ 1,906 $ 7,616 $ 5,309 $ 2,307
Core deposit intangibles 1,315 1,019 296 1,337 965 372
Other customer relationships 767 380 387 830 356 474
Present value of future profits 239 135 104 235 123 112
Indefinite-lived intangible assets 487 — 487 492 — 492
Other (1) 4,764 2,247 2,517 4,866 2,023 2,843
Intangible assets (excluding MSRs) $15,204 $9,507 $5,697 $15,376 $ 8,776 $ 6,600
Mortgage servicing rights (MSRs) 1,942 — 1,942 2,569 — 2,569
Total intangible assets $17,146 $9,507 $7,639 $17,945 $ 8,776 $ 9,169
(1) Includes contract-related intangible assets.
Intangible assets amortization expense was $856 million, $898 million
and $976 million for 2012, 2011 and 2010, respectively. Intangible assets
amortization expense is estimated to be $812 million in 2013, $723 million
in 2014, $689 million in 2015, $766 million in 2016, and $550 million
in 2017.
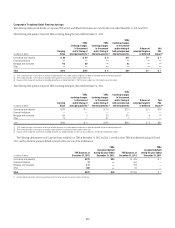
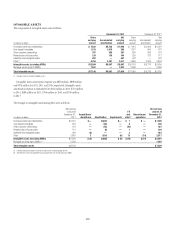
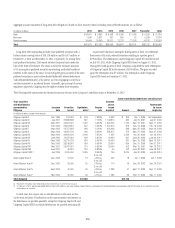
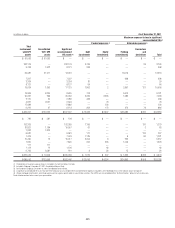
The changes in intangible assets during 2012 were as follows:
In millions of dollars
Net carrying
amount at
December 31,
2011
Acquisitions/
divestitures Amortization Impairments
FX
and
other (1)
Discontinued
operations
Net carrying
amount at
December 31,
2012
Purchased credit card relationships $ 2,307 $— $(402) $— $ 1 $ — $ 1,906
Core deposit intangibles 372 — (84) — 8 — 296
Other customer relationships 474 — (45) — (42) — 387
Present value of future profits 112 — (9) — 1 — 104
Indefinite-lived intangible assets 492 (8) — — 3 — 487
Other 2,843 2 (316) (6) 13 (19) 2,517
Intangible assets (excluding MSRs) $ 6,600 $ (6) $(856) $ (6) $ (16) $ (19) $ 5,697
Mortgage servicing rights (MSRs) (2) 2,569 1,942
Total intangible assets $ 9,169 $7,639
(1) Includes foreign exchange translation and purchase accounting adjustments.
(2) See Note 22 to the Consolidated Financial Statements for the roll-forward of MSRs.