Citibank 2012 Annual Report Download - page 72
Download and view the complete annual report
Please find page 72 of the 2012 Citibank annual report below. You can navigate through the pages in the report by either clicking on the pages listed below, or by using the keyword search tool below to find specific information within the annual report.-
 1
1 -
2
-
3
-
4
-
5
-
6
-
7
-
8
-
9
-
10
-
11
-
12
-
13
-
14
-
15
-
16
-
17
-
18
-
19
-
20
-
21
-
22
-
23
-
24
-
25
-
26
-
27
-
28
-
29
-
30
-
31
-
32
-
33
-
34
-
35
-
36
-
37
-
38
-
39
-
40
-
41
-
42
-
43
-
44
-
45
-
46
-
47
-
48
-
49
-
50
-
51
-
52
-
53
-
54
-
55
-
56
-
57
-
58
-
59
-
60
-
61
-
 62
62 -
 63
63 -
 64
64 -
 65
65 -
 66
66 -
 67
67 -
 68
68 -
 69
69 -
 70
70 -
 71
71 -
 72
72 -
 73
73 -
 74
74 -
 75
75 -
 76
76 -
 77
77 -
 78
78 -
 79
79 -
 80
80 -
 81
81 -
 82
82 -
83
-
84
-
85
-
86
-
87
-
88
-
89
-
90
-
91
-
92
-
93
-
94
-
95
-
96
-
97
-
98
-
99
-
100
-
101
-
102
-
103
-
104
-
105
-
106
-
107
-
108
-
109
-
110
-
111
-
112
-
113
-
114
-
115
-
116
-
117
-
118
-
119
-
120
-
121
-
122
-
123
-
124
-
125
-
126
-
127
-
128
-
129
-
130
-
131
-
132
-
133
-
134
-
135
-
136
-
137
-
138
-
139
-
140
-
141
-
142
-
143
-
144
-
145
-
146
-
147
-
148
-
149
-
150
-
151
-
152
-
153
-
154
-
155
-
156
-
157
-
158
-
159
-
160
-
161
-
162
-
163
-
164
-
165
-
166
-
167
-
168
-
169
-
170
-
171
-
172
-
173
-
174
-
175
-
176
-
177
-
178
-
179
-
180
-
181
-
182
-
183
-
184
-
185
-
186
-
187
-
188
-
189
-
190
-
191
-
192
-
193
-
194
-
195
-
196
-
197
-
198
-
199
-
200
-
201
-
202
-
203
-
204
-
205
-
206
-
207
-
208
-
209
-
210
-
211
-
212
-
213
-
214
-
215
-
216
-
217
-
218
-
219
-
220
-
221
-
222
-
223
-
224
-
225
-
226
-
227
-
228
-
229
-
230
-
231
-
232
-
233
-
234
-
235
-
236
-
237
-
238
-
239
-
240
-
241
-
242
-
243
-
244
-
245
-
246
-
247
-
248
-
249
-
250
-
251
-
252
-
253
-
254
-
255
-
256
-
257
-
258
-
259
-
260
-
261
-
262
-
263
-
264
-
265
-
266
-
267
-
268
-
269
-
270
-
271
-
272
-
273
-
274
-
275
-
276
-
277
-
278
-
279
-
280
-
281
-
282
-
283
-
284
-
285
-
286
-
287
-
288
-
289
-
290
-
291
-
292
-
293
-
294
-
295
-
296
-
297
-
298
-
299
-
300
-
301
-
302
-
303
-
304
-
305
-
306
-
307
-
308
-
309
-
310
-
311
-
312
-
313
-
314
-
315
-
316
-
317
-
318
-
319
-
320
-
321
-
322
-
323
-
324
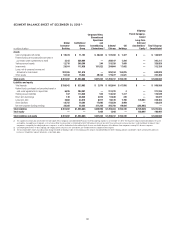
 |
 |

50
FUNDING AND LIQUIDITY
Overview
Citi’s funding and liquidity objectives generally are to maintain liquidity
to fund its existing asset base as well as grow its core businesses in Citicorp,
while at the same time maintain sufficient excess liquidity, structured
appropriately, so that it can operate under a wide variety of market
conditions, including market disruptions for both short- and long-term
periods. Citigroup’s primary liquidity objectives are established by entity, and
in aggregate, across three major categories:
• the non-bank, which is largely composed of the parent holding company
(Citigroup) and Citi’s broker-dealer subsidiaries (collectively referred to in
this section as “non-bank”);
• Citi’s significant Citibank entities, which consist of Citibank, N.A. units
domiciled in the U.S., Western Europe, Hong Kong, Japan and Singapore
(collectively referred to in this section as “significant Citibank entities”);
and
• other Citibank and Banamex entities.
At an aggregate level, Citigroup’s goal is to ensure that there is sufficient
funding in amount and tenor to ensure that aggregate liquidity resources are
available for these entities. The liquidity framework requires that entities be
self-sufficient or net providers of liquidity, including in conditions established
under their designated stress tests.
Citi’s primary sources of funding include (i) deposits via Citi’s bank
subsidiaries, which are Citi’s most stable and lowest cost source of long-term
funding, (ii) long-term debt (primarily senior and subordinated debt) issued
at the non-bank level and certain bank subsidiaries, and (iii) stockholders’
equity. These sources may be supplemented by short-term borrowings,
primarily in the form of secured financing transactions (securities loaned or
sold under agreements to repurchase, or repos).
As referenced above, Citigroup works to ensure that the structural tenor
of these funding sources is sufficiently long in relation to the tenor of its
asset base. The key goal of Citi’s asset/liability management is to ensure that
there is excess tenor in the liability structure so as to provide excess liquidity
to fund the assets. The excess liquidity resulting from a longer-term tenor
profile can effectively offset potential decreases in liquidity that may occur
under stress. This excess funding is held in the form of aggregate liquidity
resources, as described below.
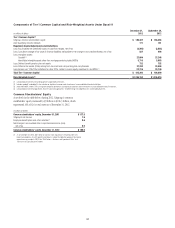
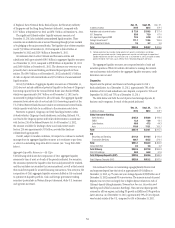
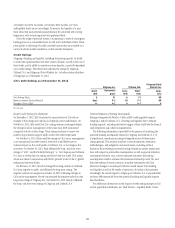
Aggregate Liquidity Resources
Non-bank Significant Citibank Entities
Other Citibank and
Banamex Entities Total
In billions of dollars
Dec. 31,
2012
Sept. 30,
2012
Dec. 31,
2011
Dec. 31,
2012
Sept. 30,
2012
Dec. 31,
2011
Dec. 31,
2012
Sept. 30,
2012
Dec. 31,
2011
Dec. 31,
2012
Sept. 30,
2012
Dec. 31,
2011
Available cash at central banks $33.2 $50.9 $29.1 $ 26.5 $ 72.7 $ 70.7 $13.3 $15.9 $ 27.6 $ 73.0 $139.5 $127.4
Unencumbered liquid securities 31.3 26.8 69.3 173.3 164.0 129.5 76.2 73.9 79.3 280.8 264.7 278.1
Total $64.5 $77.7 $98.4 $199.8 $236.7 $200.2 $89.5 $89.8 $106.9 $353.8 $404.2 $405.5
All amounts in the table above are as of period-end and may increase or
decrease intra-period in the ordinary course of business.
As set forth in the table above, Citigroup’s aggregate liquidity resources
totaled approximately $353.8 billion at December 31, 2012, compared to
$404.2 billion at September 30, 2012 and $405.5 billion at December 31,
2011. During 2011 and the first half of 2012, Citi consciously maintained
an excess liquidity position given uncertainties in both the global economic
outlook and the pace of its balance sheet deleveraging. In the second half
of 2012, as these uncertainties showed signs of abating, Citi purposefully
began to decrease its liquidity resources, primarily through long-term debt
reductions and limiting deposit growth, as well as through increased lending
to both Consumer and Corporate clients.
As discussed in more detail below, this reduction in excess liquidity in turn
contributed to a reduction in overall cost of funds, and thus improved Citi’s
net interest margin, which increased to 2.88% for full year 2012 from 2.86%
for full year 2011 (see “Deposits” and “Market Risk—Interest Revenue/
Expense and Yields” below, respectively).
At December 31, 2012, Citigroup’s non-bank aggregate liquidity
resources totaled approximately $64.5 billion, compared to $77.7 billion at
September 30, 2012 and $98.4 billion at December 31, 2011. These amounts
included unencumbered liquid securities and cash held in Citi’s U.S. and
non-U.S. broker-dealer entities. The purposeful decrease in aggregate
liquidity resources of Citi’s non-bank entities year-over-year and quarter-
over-quarter was primarily due to the continued pay down and runoff of
long-term debt, including Temporary Liquidity Guarantee Program (TLGP)
debt, which fully matured by the end of 2012.
Citigroup’s significant Citibank entities had approximately
$199.8 billion of aggregate liquidity resources as of December 31, 2012,
compared to $236.7 billion at September 30, 2012 and $200.2 billion at
December 31, 2011. The decrease in aggregate liquidity resources during
the fourth quarter of 2012 was primarily due to an anticipated reduction in
episodic deposits and the expiration of the Transaction Account Guarantee
(TAG) program (see “Deposits” below), as well as the repayment of
remaining TLGP borrowings and a reduction in secured borrowings. As of
December 31, 2012, the significant Citibank entities’ liquidity resources
included $26.5 billion of cash on deposit with major central banks
(including the U.S. Federal Reserve Bank, European Central Bank, Bank