Citibank 2012 Annual Report Download - page 285
Download and view the complete annual report
Please find page 285 of the 2012 Citibank annual report below. You can navigate through the pages in the report by either clicking on the pages listed below, or by using the keyword search tool below to find specific information within the annual report.-
 1
1 -
2
-
3
-
4
-
5
-
6
-
7
-
8
-
9
-
10
-
11
-
12
-
13
-
14
-
15
-
16
-
17
-
18
-
19
-
20
-
21
-
22
-
23
-
24
-
25
-
26
-
27
-
28
-
29
-
30
-
31
-
32
-
33
-
34
-
35
-
36
-
37
-
38
-
39
-
40
-
41
-
42
-
43
-
44
-
45
-
46
-
47
-
48
-
49
-
50
-
51
-
52
-
53
-
54
-
55
-
56
-
57
-
58
-
59
-
60
-
61
-
62
-
63
-
64
-
65
-
66
-
67
-
68
-
69
-
70
-
71
-
72
-
73
-
74
-
75
-
76
-
77
-
78
-
79
-
80
-
81
-
82
-
83
-
84
-
85
-
86
-
87
-
88
-
89
-
90
-
91
-
92
-
93
-
94
-
95
-
96
-
97
-
98
-
99
-
100
-
101
-
102
-
103
-
104
-
105
-
106
-
107
-
108
-
109
-
110
-
111
-
112
-
113
-
114
-
115
-
116
-
117
-
118
-
119
-
120
-
121
-
122
-
123
-
124
-
125
-
126
-
127
-
128
-
129
-
130
-
131
-
132
-
133
-
134
-
135
-
136
-
137
-
138
-
139
-
140
-
141
-
142
-
143
-
144
-
145
-
146
-
147
-
148
-
149
-
150
-
151
-
152
-
153
-
154
-
155
-
156
-
157
-
158
-
159
-
160
-
161
-
162
-
163
-
164
-
165
-
166
-
167
-
168
-
169
-
170
-
171
-
172
-
173
-
174
-
175
-
176
-
177
-
178
-
179
-
180
-
181
-
182
-
183
-
184
-
185
-
186
-
187
-
188
-
189
-
190
-
191
-
192
-
193
-
194
-
195
-
196
-
197
-
198
-
199
-
200
-
201
-
202
-
203
-
204
-
205
-
206
-
207
-
208
-
209
-
210
-
211
-
212
-
213
-
214
-
215
-
216
-
217
-
218
-
219
-
220
-
221
-
222
-
223
-
224
-
225
-
226
-
227
-
228
-
229
-
230
-
231
-
232
-
233
-
234
-
235
-
236
-
237
-
238
-
239
-
240
-
241
-
242
-
243
-
244
-
245
-
246
-
247
-
248
-
249
-
250
-
251
-
252
-
253
-
254
-
255
-
256
-
257
-
258
-
259
-
260
-
261
-
262
-
263
-
264
-
265
-
266
-
267
-
268
-
269
-
270
-
271
-
272
-
273
-
274
-
 275
275 -
 276
276 -
 277
277 -
 278
278 -
 279
279 -
 280
280 -
 281
281 -
 282
282 -
 283
283 -
 284
284 -
 285
285 -
 286
286 -
 287
287 -
 288
288 -
 289
289 -
 290
290 -
 291
291 -
 292
292 -
 293
293 -
 294
294 -
 295
295 -
296
-
297
-
298
-
299
-
300
-
301
-
302
-
303
-
304
-
305
-
306
-
307
-
308
-
309
-
310
-
311
-
312
-
313
-
314
-
315
-
316
-
317
-
318
-
319
-
320
-
321
-
322
-
323
-
324
 |
 |

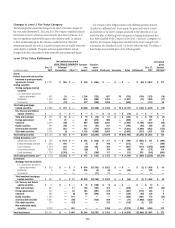
263
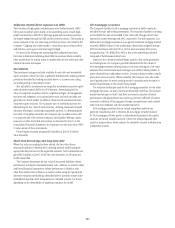
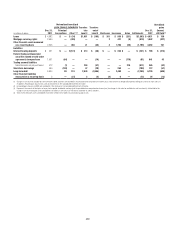
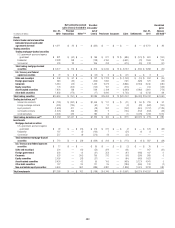
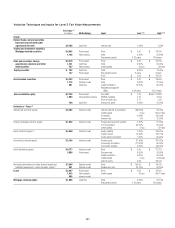
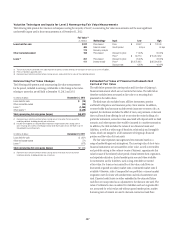
Valuation Techniques and Inputs for Level 3 Fair Value Measurements
Fair Value
(in millions)
(1)
Methodology Input Low (2)(3) High (2)(3)
Assets
Federal funds sold and securities
borrowed or purchased under
agreements to resell $ 4,786 Cash flow Interest rate 1.09% 1.50%
Trading and investment securities
Mortgage-backed securities $4,402 Price-based Price $ 0.00 $ 135.00
1,148 Yield analysis Yield 0.00% 25.84%
Prepayment period 2.16 years 7.84 years
State and municipal, foreign
government, corporate and other
debt securities
$4,416 Price-based Price $ 0.00 $ 159.63
1,231 Cash flow Yield 0.00% 30.00%
787 Yield analysis Credit spread 35 bps 300 bps
Equity securities $ 792 Cash flow Yield 9.00% 10.00%
147 Price-based Prepayment period 3 years 3 years
Price $ 0.00 $ 750.00
Asset-backed securities $ 4,253 Price-based Price $ 0.00 $ 136.63
1,775 Internal model Yield 0.00% 27.00%
561 Cash flow Credit correlation 15.00% 90.00%
Weighted average life
(WAL) 0.34 years 16.07 years
Non-marketable equity $2,768 Price-based Fund NAV $ 1.00 $456,773,838
1,803 Comparables analysis EBITDA multiples 4.70 14.39
Price-to-book ratio 0.77 1.50
709 Cash flow Discount to price 0.00 % 75.00%
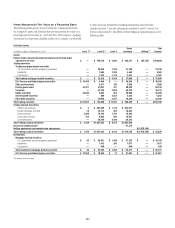
Derivatives – Gross (4)
Interest rate contracts (gross) $3,202 Internal model Interest rate (IR)-IR correlation (98.00)% 90.00%
Credit spread 0 bps 550.27 bps
IR volatility 0.09% 100.00%
Interest rate 0% 15.00%
Foreign exchange contracts (gross) $ 1,542 Internal model Foreign exchange (FX) volatility 3.20% 67.35%
IR-FX correlation 40.00% 60.00%
Credit spread 0 bps 376 bps
Equity contracts (gross) (5) $4,669 Internal model Equity volatility 1.00% 185.20%
Equity forward 74.94% 132.70%
Equity-equity correlation 1.00% 99.90%
Commodity contracts (gross) $2,160 Internal model Forward price 37.45% 181.50%
Commodity correlation (77.00)% 95.00%
Commodity volatility 5.00% 148.00%
Credit derivatives (gross) $4,777 Internal model Price $ 0.00 $ 121.16
3,886 Price-based Recovery rate 6.50% 78.00%
Credit correlation 5.00% 99.00%
Credit spread 0 bps 2,236 bps
Upfront points 3.62 100.00
Nontrading derivatives and other financial assets and
liabilities measured on a recurring basis (gross) (4)
$2,000 External model Price $ 100.00 $ 100.00
461 Internal model Redemption rate 30.79% 99.50%
Loans $ 2,447 Price-based Price $ 0.00 $ 103.32
1,423 Yield analysis Credit spread 55 bps 600.19 bps
888 Internal model
Mortgage servicing rights $ 1,858 Cash flow Yield 0.00% 53.19%
Prepayment period 2.16 years 7.84 years