Citibank 2012 Annual Report Download - page 184
Download and view the complete annual report
Please find page 184 of the 2012 Citibank annual report below. You can navigate through the pages in the report by either clicking on the pages listed below, or by using the keyword search tool below to find specific information within the annual report.-
 1
1 -
2
-
3
-
4
-
5
-
6
-
7
-
8
-
9
-
10
-
11
-
12
-
13
-
14
-
15
-
16
-
17
-
18
-
19
-
20
-
21
-
22
-
23
-
24
-
25
-
26
-
27
-
28
-
29
-
30
-
31
-
32
-
33
-
34
-
35
-
36
-
37
-
38
-
39
-
40
-
41
-
42
-
43
-
44
-
45
-
46
-
47
-
48
-
49
-
50
-
51
-
52
-
53
-
54
-
55
-
56
-
57
-
58
-
59
-
60
-
61
-
62
-
63
-
64
-
65
-
66
-
67
-
68
-
69
-
70
-
71
-
72
-
73
-
74
-
75
-
76
-
77
-
78
-
79
-
80
-
81
-
82
-
83
-
84
-
85
-
86
-
87
-
88
-
89
-
90
-
91
-
92
-
93
-
94
-
95
-
96
-
97
-
98
-
99
-
100
-
101
-
102
-
103
-
104
-
105
-
106
-
107
-
108
-
109
-
110
-
111
-
112
-
113
-
114
-
115
-
116
-
117
-
118
-
119
-
120
-
121
-
122
-
123
-
124
-
125
-
126
-
127
-
128
-
129
-
130
-
131
-
132
-
133
-
134
-
135
-
136
-
137
-
138
-
139
-
140
-
141
-
142
-
143
-
144
-
145
-
146
-
147
-
148
-
149
-
150
-
151
-
152
-
153
-
154
-
155
-
156
-
157
-
158
-
159
-
160
-
161
-
162
-
163
-
164
-
165
-
166
-
167
-
168
-
169
-
170
-
171
-
172
-
173
-
 174
174 -
 175
175 -
 176
176 -
 177
177 -
 178
178 -
 179
179 -
 180
180 -
 181
181 -
 182
182 -
 183
183 -
 184
184 -
 185
185 -
 186
186 -
 187
187 -
 188
188 -
 189
189 -
 190
190 -
 191
191 -
 192
192 -
 193
193 -
 194
194 -
195
-
196
-
197
-
198
-
199
-
200
-
201
-
202
-
203
-
204
-
205
-
206
-
207
-
208
-
209
-
210
-
211
-
212
-
213
-
214
-
215
-
216
-
217
-
218
-
219
-
220
-
221
-
222
-
223
-
224
-
225
-
226
-
227
-
228
-
229
-
230
-
231
-
232
-
233
-
234
-
235
-
236
-
237
-
238
-
239
-
240
-
241
-
242
-
243
-
244
-
245
-
246
-
247
-
248
-
249
-
250
-
251
-
252
-
253
-
254
-
255
-
256
-
257
-
258
-
259
-
260
-
261
-
262
-
263
-
264
-
265
-
266
-
267
-
268
-
269
-
270
-
271
-
272
-
273
-
274
-
275
-
276
-
277
-
278
-
279
-
280
-
281
-
282
-
283
-
284
-
285
-
286
-
287
-
288
-
289
-
290
-
291
-
292
-
293
-
294
-
295
-
296
-
297
-
298
-
299
-
300
-
301
-
302
-
303
-
304
-
305
-
306
-
307
-
308
-
309
-
310
-
311
-
312
-
313
-
314
-
315
-
316
-
317
-
318
-
319
-
320
-
321
-
322
-
323
-
324
 |
 |

162
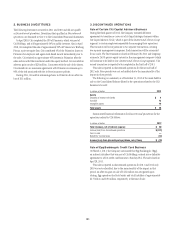
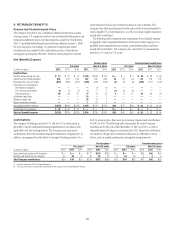
Summarized financial information for Discontinued operations,
including cash flows, for the credit card operations related to Egg follows:
In millions of dollars 2012 2011
Total revenues, net of interest expense $ 1 $340
Income (loss) from discontinued operations $ (96) $ 24
Gain (loss) on sale (1) 143
(Benefit) provision for income taxes (34) 58
Income (loss) from discontinued operations, net of taxes $ (63) $109
Cash Flows from Discontinued Operations
In millions of dollars 2012 2011
Cash flows from operating activities $— $ (146)
Cash flows from investing activities —2,827
Cash flows from financing activities —(12)
Net cash provided by discontinued operations $— $2,669
Sale of The Student Loan Corporation
On September 17, 2010, the Company announced that The Student
Loan Corporation (SLC), an indirect subsidiary that was 80% owned by
Citibank and 20% owned by public shareholders, and which was part of Citi
Holdings, entered into definitive agreements that resulted in the divestiture
of Citi’s private student loan business and approximately $31 billion of its
approximate $40 billion in assets to Discover Financial Services (Discover)
and SLM Corporation (Sallie Mae). The transaction closed on December 31,
2010. As part of the transaction, Citi provided Sallie Mae with $1.1 billion
of seller-financing. Additionally, as part of the transactions, Citibank, N.A.
purchased approximately $8.6 billion of assets from SLC prior to the sale
of SLC.
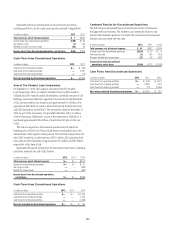
This sale was reported as discontinued operations for the third and
fourth quarters of 2010 only. Prior periods were not reclassified, due to the
immateriality of the impact in those periods. The total 2010 impact from the
sale of SLC resulted in an after-tax loss of $427 million. SLC operations had
total assets and total liabilities of approximately $31 billion and $29 billion,
respectively, at the time of sale.
Summarized financial information for discontinued operations, including
cash flows, related to the sale of SLC follows:
In millions of dollars 2012 2011 2010
Total revenues, net of interest expense $— $— $(577)
Income from discontinued operations $— $— $ 97
Gain (loss) on sale —— (825)
Benefit for income taxes —— (339)
Income (loss) from discontinued operations,
net of taxes $— $— $(389)
Cash Flows from Discontinued Operations
In millions of dollars 2012 2011 2010
Cash flows from operating activities $— $— $ 5,106
Cash flows from investing activities —— 1,532
Cash flows from financing activities —— (6,483)
Net cash provided by discontinued operations $— $— $ 155
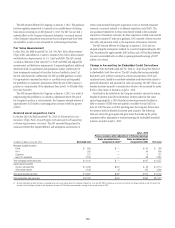
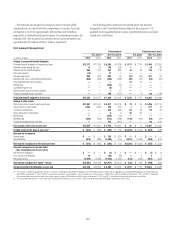
Combined Results for Discontinued Operations
The following is summarized financial information for the CCA business,
the Egg credit card business, The Student Loan Corporation business and
previous discontinued operations, for which Citi continues to have minimal
residual costs associated with the sales.
In millions of dollars 2012 2011 2010
Total revenues, net of interest expense $ 61 $ 352 $ (410)
Income (loss) from discontinued operations $(219) $ 23 $ 72
Gain (loss) on sale (1) 155 (702)
Provision (benefit) for income taxes (71) 66 (562)
Income (loss) from discontinued
operations, net of taxes $(149) $
112 $ (68)
Cash Flows from Discontinued Operations
In millions of dollars 2012 2011 2010
Cash flows from operating activities $— $ (146) $ 4,974
Cash flows from investing activities —2,827 1,726
Cash flows from financing activities —(12) (6,486)
Net cash provided by discontinued operations $— $2,669 $ 214