Citibank 2012 Annual Report Download - page 38
Download and view the complete annual report
Please find page 38 of the 2012 Citibank annual report below. You can navigate through the pages in the report by either clicking on the pages listed below, or by using the keyword search tool below to find specific information within the annual report.-
 1
1 -
2
-
3
-
4
-
5
-
6
-
7
-
8
-
9
-
10
-
11
-
12
-
13
-
14
-
15
-
16
-
17
-
18
-
19
-
20
-
21
-
22
-
23
-
24
-
25
-
26
-
27
-
 28
28 -
 29
29 -
 30
30 -
 31
31 -
 32
32 -
 33
33 -
 34
34 -
 35
35 -
 36
36 -
 37
37 -
 38
38 -
 39
39 -
 40
40 -
 41
41 -
 42
42 -
 43
43 -
 44
44 -
 45
45 -
 46
46 -
 47
47 -
 48
48 -
49
-
50
-
51
-
52
-
53
-
54
-
55
-
56
-
57
-
58
-
59
-
60
-
61
-
62
-
63
-
64
-
65
-
66
-
67
-
68
-
69
-
70
-
71
-
72
-
73
-
74
-
75
-
76
-
77
-
78
-
79
-
80
-
81
-
82
-
83
-
84
-
85
-
86
-
87
-
88
-
89
-
90
-
91
-
92
-
93
-
94
-
95
-
96
-
97
-
98
-
99
-
100
-
101
-
102
-
103
-
104
-
105
-
106
-
107
-
108
-
109
-
110
-
111
-
112
-
113
-
114
-
115
-
116
-
117
-
118
-
119
-
120
-
121
-
122
-
123
-
124
-
125
-
126
-
127
-
128
-
129
-
130
-
131
-
132
-
133
-
134
-
135
-
136
-
137
-
138
-
139
-
140
-
141
-
142
-
143
-
144
-
145
-
146
-
147
-
148
-
149
-
150
-
151
-
152
-
153
-
154
-
155
-
156
-
157
-
158
-
159
-
160
-
161
-
162
-
163
-
164
-
165
-
166
-
167
-
168
-
169
-
170
-
171
-
172
-
173
-
174
-
175
-
176
-
177
-
178
-
179
-
180
-
181
-
182
-
183
-
184
-
185
-
186
-
187
-
188
-
189
-
190
-
191
-
192
-
193
-
194
-
195
-
196
-
197
-
198
-
199
-
200
-
201
-
202
-
203
-
204
-
205
-
206
-
207
-
208
-
209
-
210
-
211
-
212
-
213
-
214
-
215
-
216
-
217
-
218
-
219
-
220
-
221
-
222
-
223
-
224
-
225
-
226
-
227
-
228
-
229
-
230
-
231
-
232
-
233
-
234
-
235
-
236
-
237
-
238
-
239
-
240
-
241
-
242
-
243
-
244
-
245
-
246
-
247
-
248
-
249
-
250
-
251
-
252
-
253
-
254
-
255
-
256
-
257
-
258
-
259
-
260
-
261
-
262
-
263
-
264
-
265
-
266
-
267
-
268
-
269
-
270
-
271
-
272
-
273
-
274
-
275
-
276
-
277
-
278
-
279
-
280
-
281
-
282
-
283
-
284
-
285
-
286
-
287
-
288
-
289
-
290
-
291
-
292
-
293
-
294
-
295
-
296
-
297
-
298
-
299
-
300
-
301
-
302
-
303
-
304
-
305
-
306
-
307
-
308
-
309
-
310
-
311
-
312
-
313
-
314
-
315
-
316
-
317
-
318
-
319
-
320
-
321
-
322
-
323
-
324
 |
 |

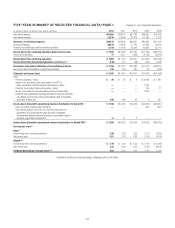
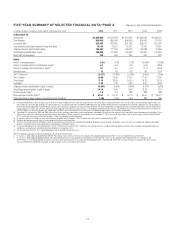
16
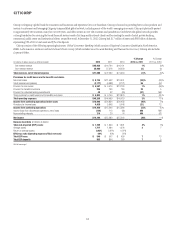
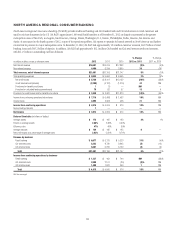
NORTH AMERICA REGIONAL CONSUMER BANKING
North America Regional Consumer Banking (NA RCB) provides traditional banking and Citi-branded cards and Citi retail services to retail customers and
small to mid-size businesses in the U.S. NA RCB’s approximate 1,000 retail bank branches as of December 31, 2012 are largely concentrated in the greater
metropolitan areas of New York, Los Angeles, San Francisco, Chicago, Miami, Washington, D.C., Boston, Philadelphia, Dallas, Houston, San Antonio and
Austin. As announced in the fourth quarter of 2012, as part of its repositioning efforts, Citi expects to optimize its branch network in North America and further
concentrate its presence in major metropolitan areas. At December 31, 2012, NA RCB had approximately 12.4 million customer accounts, $42.7 billion of retail
banking loans and $165.2 billion of deposits. In addition, NA RCB had approximately 102.1 million Citi-branded and Citi retail services credit card accounts,
with $111.5 billion in outstanding card loan balances.
In millions of dollars, except as otherwise noted 2012 2011 2010
% Change
2012 vs. 2011
% Change
2011 vs. 2010
Net interest revenue $16,591 $16,915 $17,892 (2)% (5)%
Non-interest revenue 4,490 3,244 3,855 38 (16)
Total revenues, net of interest expense $21,081 $20,159 $21,747 5% (7)%
Total operating expenses $ 9,933 $ 9,690 $ 8,445 3% 15%
Net credit losses $ 5,756 $ 8,101 $13,132 (29)% (38)%
Credit reserve build (release) (2,389) (4,181) (1,319) 43 NM
Provisions for benefits and claims 1(1) — NM —
Provision for unfunded lending commitments 70 62 57 13 9
Provisions for credit losses and for benefits and claims $ 3,438 $ 3,981 $11,870 (14)% (66)%
Income from continuing operations before taxes $ 7,710 $ 6,488 $ 1,432 19% NM
Income taxes 2,895 2,393 458 21 NM
Income from continuing operations $ 4,815 $ 4,095 $ 974 18% NM
Noncontrolling interests 1— — ——
Net income $ 4,814 $ 4,095 $ 974 18% NM
Balance Sheet data (in billions of dollars)
Average assets $ 172 $ 165 $ 163 4% 1%
Return on average assets 2.80% 2.48% 0.60%
Efficiency ratio 47% 48% 39%
Average deposits $ 154 $ 145 $ 145 6—
Net credit losses as a percentage of average loans 3.83% 5.50% 8.71%
Revenue by business
Retail banking $ 6,677 $ 5,113 $ 5,323 31% (4)%
Citi-branded cards 8,323 8,730 9,695 (5) (10)
Citi retail services 6,081 6,316 6,729 (4) (6)
Total $21,081 $20,159 $21,747 5% (7)%
Income from continuing operations by business
Retail banking $ 1,237 $ 463 $ 744 NM (38)%
Citi-branded cards 2,080 2,151 (24) (3)% NM
Citi retail services 1,498 1,481 254 1NM
Total $ 4,815 $ 4,095 $ 974 18% NM
NM Not meaningful