Citibank 2012 Annual Report Download - page 46
Download and view the complete annual report
Please find page 46 of the 2012 Citibank annual report below. You can navigate through the pages in the report by either clicking on the pages listed below, or by using the keyword search tool below to find specific information within the annual report.-
 1
1 -
2
-
3
-
4
-
5
-
6
-
7
-
8
-
9
-
10
-
11
-
12
-
13
-
14
-
15
-
16
-
17
-
18
-
19
-
20
-
21
-
22
-
23
-
24
-
25
-
26
-
27
-
28
-
29
-
30
-
31
-
32
-
33
-
34
-
35
-
 36
36 -
 37
37 -
 38
38 -
 39
39 -
 40
40 -
 41
41 -
 42
42 -
 43
43 -
 44
44 -
 45
45 -
 46
46 -
 47
47 -
 48
48 -
 49
49 -
 50
50 -
 51
51 -
 52
52 -
 53
53 -
 54
54 -
 55
55 -
 56
56 -
57
-
58
-
59
-
60
-
61
-
62
-
63
-
64
-
65
-
66
-
67
-
68
-
69
-
70
-
71
-
72
-
73
-
74
-
75
-
76
-
77
-
78
-
79
-
80
-
81
-
82
-
83
-
84
-
85
-
86
-
87
-
88
-
89
-
90
-
91
-
92
-
93
-
94
-
95
-
96
-
97
-
98
-
99
-
100
-
101
-
102
-
103
-
104
-
105
-
106
-
107
-
108
-
109
-
110
-
111
-
112
-
113
-
114
-
115
-
116
-
117
-
118
-
119
-
120
-
121
-
122
-
123
-
124
-
125
-
126
-
127
-
128
-
129
-
130
-
131
-
132
-
133
-
134
-
135
-
136
-
137
-
138
-
139
-
140
-
141
-
142
-
143
-
144
-
145
-
146
-
147
-
148
-
149
-
150
-
151
-
152
-
153
-
154
-
155
-
156
-
157
-
158
-
159
-
160
-
161
-
162
-
163
-
164
-
165
-
166
-
167
-
168
-
169
-
170
-
171
-
172
-
173
-
174
-
175
-
176
-
177
-
178
-
179
-
180
-
181
-
182
-
183
-
184
-
185
-
186
-
187
-
188
-
189
-
190
-
191
-
192
-
193
-
194
-
195
-
196
-
197
-
198
-
199
-
200
-
201
-
202
-
203
-
204
-
205
-
206
-
207
-
208
-
209
-
210
-
211
-
212
-
213
-
214
-
215
-
216
-
217
-
218
-
219
-
220
-
221
-
222
-
223
-
224
-
225
-
226
-
227
-
228
-
229
-
230
-
231
-
232
-
233
-
234
-
235
-
236
-
237
-
238
-
239
-
240
-
241
-
242
-
243
-
244
-
245
-
246
-
247
-
248
-
249
-
250
-
251
-
252
-
253
-
254
-
255
-
256
-
257
-
258
-
259
-
260
-
261
-
262
-
263
-
264
-
265
-
266
-
267
-
268
-
269
-
270
-
271
-
272
-
273
-
274
-
275
-
276
-
277
-
278
-
279
-
280
-
281
-
282
-
283
-
284
-
285
-
286
-
287
-
288
-
289
-
290
-
291
-
292
-
293
-
294
-
295
-
296
-
297
-
298
-
299
-
300
-
301
-
302
-
303
-
304
-
305
-
306
-
307
-
308
-
309
-
310
-
311
-
312
-
313
-
314
-
315
-
316
-
317
-
318
-
319
-
320
-
321
-
322
-
323
-
324
 |
 |

24
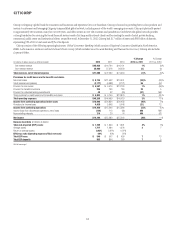
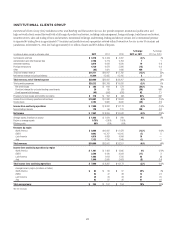
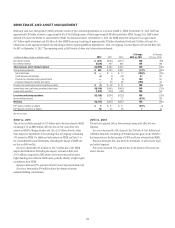
INSTITUTIONAL CLIENTS GROUP
Institutional Clients Group (ICG) includes Securities and Banking and Transaction Services. ICG provides corporate, institutional, public sector and
high-net-worth clients around the world with a full range of products and services, including cash management, foreign exchange, trade finance and services,
securities services, sales and trading of loans and securities, institutional brokerage, underwriting, lending and advisory services. ICG’s international presence
is supported by trading floors in approximately 75 countries and jurisdictions and a proprietary network within Transaction Services in over 95 countries and
jurisdictions. At December 31, 2012, ICG had approximately $1.1 trillion of assets and $523 billion of deposits.
In millions of dollars, except as otherwise noted 2012 2011 2010
% Change
2012 vs. 2011
% Change
2011 vs. 2010
Commissions and fees $ 4,318 $ 4,449 $ 4,267 (3)% 4%
Administration and other fiduciary fees 2,790 2,775 2,753 11
Investment banking 3,618 3,029 3,520 19 (14)
Principal transactions 4,130 4,873 5,566 (15) (12)
Other (85) 1,821 1,686 NM 8
Total non-interest revenue $14,771 $16,947 $ 17,792 (13)% (5)%
Net interest revenue (including dividends) 15,829 15,055 15,415 5(2)
Total revenues, net of interest expense $30,600 $32,002 $ 33,207 (4)% (4)%
Total operating expenses $20,232 $20,768 $ 19,626 (3)% 6%
Net credit losses $ 282 $ 619 $ 573 (54)% 8%
Provision (release) for unfunded lending commitments 39 89 (29) (56) NM
Credit reserve build (release) (45) (556) (626) 92 11
Provisions for loan losses and benefits and claims $ 276 $ 152 $ (82) 82% NM
Income from continuing operations before taxes $10,092 $11,082 $ 13,663 (9)% (19)%
Income taxes 2,102 2,820 3,490 (25) (19)
Income from continuing operations $ 7,990 $ 8,262 $ 10,173 (3)% (19)%
Noncontrolling interests 128 56 131 NM (57)
Net income $ 7,862 $ 8,206 $ 10,042 (4)% (18)%
Average assets (in billions of dollars) $ 1,042 $ 1,024 $ 949 2% 8%
Return on average assets 0.75% 0.80% 1.06%
Efficiency ratio 66% 65% 59%
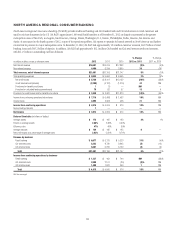
Revenues by region
North America $ 8,668 $10,002 $ 11,878 (13)% (16)%
EMEA 9,993 10,707 10,205 (7) 5
Latin America 4,816 4,083 4,084 18 —
Asia 7,123 7,210 7,040 (1) 2
Total revenues $30,600 $32,002 $ 33,207 (4)% (4)%
Income from continuing operations by region
North America $ 1,481 $ 1,459 $ 2,985 2% (51)%
EMEA 2,598 3,130 3,029 (17) 3
Latin America 1,962 1,613 1,756 22 (8)
Asia 1,949 2,060 2,403 (5) (14)
Total income from continuing operations $ 7,990 $ 8,262 $ 10,173 (3)% (19)%
Average loans by region (in billions of dollars)
North America $ 83 $ 69 $ 67 20% 3%
EMEA 53 47 38 13 24
Latin America 35 29 23 21 26
Asia 63 52 36 21 44
Total average loans $ 234 $ 197 $ 164 19% 20%
NM Not meaningful