Citibank 2012 Annual Report Download - page 244
Download and view the complete annual report
Please find page 244 of the 2012 Citibank annual report below. You can navigate through the pages in the report by either clicking on the pages listed below, or by using the keyword search tool below to find specific information within the annual report.-
 1
1 -
2
-
3
-
4
-
5
-
6
-
7
-
8
-
9
-
10
-
11
-
12
-
13
-
14
-
15
-
16
-
17
-
18
-
19
-
20
-
21
-
22
-
23
-
24
-
25
-
26
-
27
-
28
-
29
-
30
-
31
-
32
-
33
-
34
-
35
-
36
-
37
-
38
-
39
-
40
-
41
-
42
-
43
-
44
-
45
-
46
-
47
-
48
-
49
-
50
-
51
-
52
-
53
-
54
-
55
-
56
-
57
-
58
-
59
-
60
-
61
-
62
-
63
-
64
-
65
-
66
-
67
-
68
-
69
-
70
-
71
-
72
-
73
-
74
-
75
-
76
-
77
-
78
-
79
-
80
-
81
-
82
-
83
-
84
-
85
-
86
-
87
-
88
-
89
-
90
-
91
-
92
-
93
-
94
-
95
-
96
-
97
-
98
-
99
-
100
-
101
-
102
-
103
-
104
-
105
-
106
-
107
-
108
-
109
-
110
-
111
-
112
-
113
-
114
-
115
-
116
-
117
-
118
-
119
-
120
-
121
-
122
-
123
-
124
-
125
-
126
-
127
-
128
-
129
-
130
-
131
-
132
-
133
-
134
-
135
-
136
-
137
-
138
-
139
-
140
-
141
-
142
-
143
-
144
-
145
-
146
-
147
-
148
-
149
-
150
-
151
-
152
-
153
-
154
-
155
-
156
-
157
-
158
-
159
-
160
-
161
-
162
-
163
-
164
-
165
-
166
-
167
-
168
-
169
-
170
-
171
-
172
-
173
-
174
-
175
-
176
-
177
-
178
-
179
-
180
-
181
-
182
-
183
-
184
-
185
-
186
-
187
-
188
-
189
-
190
-
191
-
192
-
193
-
194
-
195
-
196
-
197
-
198
-
199
-
200
-
201
-
202
-
203
-
204
-
205
-
206
-
207
-
208
-
209
-
210
-
211
-
212
-
213
-
214
-
215
-
216
-
217
-
218
-
219
-
220
-
221
-
222
-
223
-
224
-
225
-
226
-
227
-
228
-
229
-
230
-
231
-
232
-
233
-
 234
234 -
 235
235 -
 236
236 -
 237
237 -
 238
238 -
 239
239 -
 240
240 -
 241
241 -
 242
242 -
 243
243 -
 244
244 -
 245
245 -
 246
246 -
 247
247 -
 248
248 -
 249
249 -
 250
250 -
 251
251 -
 252
252 -
 253
253 -
 254
254 -
255
-
256
-
257
-
258
-
259
-
260
-
261
-
262
-
263
-
264
-
265
-
266
-
267
-
268
-
269
-
270
-
271
-
272
-
273
-
274
-
275
-
276
-
277
-
278
-
279
-
280
-
281
-
282
-
283
-
284
-
285
-
286
-
287
-
288
-
289
-
290
-
291
-
292
-
293
-
294
-
295
-
296
-
297
-
298
-
299
-
300
-
301
-
302
-
303
-
304
-
305
-
306
-
307
-
308
-
309
-
310
-
311
-
312
-
313
-
314
-
315
-
316
-
317
-
318
-
319
-
320
-
321
-
322
-
323
-
324
 |
 |

222
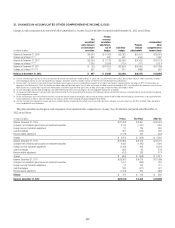
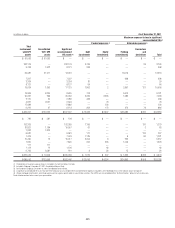
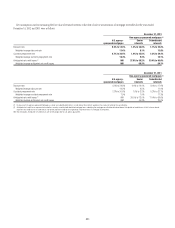
21. CHANGES IN ACCUMULATED OTHER COMPREHENSIVE INCOME (LOSS)
Changes in each component of Accumulated other comprehensive income (loss) for the three-year period ended December 31, 2012 are as follows:
In millions of dollars
Net
unrealized
gains (losses)
on investment
securities
Foreign
currency
translation
adjustment,
net of
hedges
Cash flow
hedges
Pension
liability
adjustments
Accumulated
other
comprehensive
income (loss)
Balance at December 31, 2009 $(4,347) $ (7,947) $(3,182) $(3,461) $ (18,937)
Change, net of taxes (1)(2)(3)(4) 1,952 820 532 (644) 2,660
Balance at December 31, 2010 $(2,395) $ (7,127) $(2,650) $(4,105) $ (16,277)
Change, net of taxes (1)(2)(3)(4) 2,360 (3,524) (170) (177) (1,511)
Balance at December 31, 2011 $ (35) $ (10,651) $(2,820) $(4,282) $ (17,788)
Change, net of taxes (1)(2)(3)(4)(5)(6) 632 721 527 (988) 892
Balance at December 31, 2012 $ 597 $ (9,930) $(2,293) $(5,270) $(16,896)
(1) The after-tax realized gains (losses) on sales and impairments of securities during the years ended December 31, 2012, 2011 and 2010 were $(1,017) million, $(122) million and $657 million, respectively. For details
of the realized gains (losses) on sales and impairments on Citigroup’s investment securities included in income, see Note 15 to the Consolidated Financial Statements.
(2) Primarily reflects the movements in (by order of impact) the Mexican peso, Japanese yen, Euro, and Brazilian real against the U.S. dollar, and changes in related tax effects and hedges in 2012. Primarily reflects the
movements in the Mexican peso, Turkish lira, Brazilian real, Indian rupee and Polish zloty against the U.S. dollar, and changes in related tax effects and hedges in 2011. Primarily reflects the movements in the Australian
dollar, Brazilian real, Canadian dollar, Japanese yen, Mexican peso, and Chinese yuan (renminbi) against the U.S. dollar, and changes in related tax effects and hedges in 2010.
(3) For cash flow hedges, primarily driven by Citigroup’s pay fixed/receive floating interest rate swap programs that are hedging the floating rates on liabilities.
(4) For the pension liability adjustment, primarily reflects adjustments based on the final year-end actuarial valuations of the Company’s pension and postretirement plans and amortization of amounts previously recognized
in other comprehensive income.
(5) For net unrealized gains (losses) on investment securities, includes the after-tax impact of realized gains from the sales of minority investments: $672 million from the Company’s entire interest in Housing Development
Finance Corporation Ltd. (HDFC); and $421 million from the Company’s entire interest in Shanghai Pudong Development Bank (SPDB).
(6) The after-tax impact due to impairment charges and the loss related to Akbank, included within the foreign currency translation adjustment, during the six months ended June 30, 2012 was $667 million. See Note 15
to the Consolidated Financial Statements.
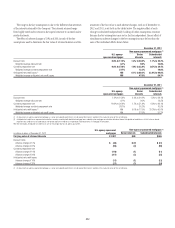
The pretax and after-tax changes in each component of Accumulated other comprehensive income (loss) for the three-year period ended December 31,
2012 are as follows:
In millions of dollars Pretax Tax effect After-tax
Balance, December 31, 2009 $ (27,834) $ 8,897 $ (18,937)
Change in net unrealized gains (losses) on investment securities 3,119 (1,167) 1,952
Foreign currency translation adjustment 81 739 820
Cash flow hedges 857 (325) 532
Pension liability adjustment (1,078) 434 (644)
Change $ 2,979 $ (319) $ 2,660
Balance, December 31, 2010 $ (24,855) $ 8,578 $ (16,277)
Change in net unrealized gains (losses) on investment securities 3,855 (1,495) 2,360
Foreign currency translation adjustment (4,133) 609 (3,524)
Cash flow hedges (262) 92 (170)
Pension liability adjustment (412) 235 (177)
Change $ (952) $ (559) $ (1,511)
Balance, December 31, 2011 $ (25,807) $ 8,019 $ (17,788)
Change in net unrealized gains (losses) on investment securities 1,001 (369) 632
Foreign currency translation adjustment 12 709 721
Cash flow hedges 838 (311) 527
Pension liability adjustment (1,378) 390 (988)
Change $ 473 $ 419 $ 892
Balance, December 31, 2012 $(25,334) $ 8,438 $(16,896)