Citibank 2012 Annual Report Download - page 264
Download and view the complete annual report
Please find page 264 of the 2012 Citibank annual report below. You can navigate through the pages in the report by either clicking on the pages listed below, or by using the keyword search tool below to find specific information within the annual report.-
 1
1 -
2
-
3
-
4
-
5
-
6
-
7
-
8
-
9
-
10
-
11
-
12
-
13
-
14
-
15
-
16
-
17
-
18
-
19
-
20
-
21
-
22
-
23
-
24
-
25
-
26
-
27
-
28
-
29
-
30
-
31
-
32
-
33
-
34
-
35
-
36
-
37
-
38
-
39
-
40
-
41
-
42
-
43
-
44
-
45
-
46
-
47
-
48
-
49
-
50
-
51
-
52
-
53
-
54
-
55
-
56
-
57
-
58
-
59
-
60
-
61
-
62
-
63
-
64
-
65
-
66
-
67
-
68
-
69
-
70
-
71
-
72
-
73
-
74
-
75
-
76
-
77
-
78
-
79
-
80
-
81
-
82
-
83
-
84
-
85
-
86
-
87
-
88
-
89
-
90
-
91
-
92
-
93
-
94
-
95
-
96
-
97
-
98
-
99
-
100
-
101
-
102
-
103
-
104
-
105
-
106
-
107
-
108
-
109
-
110
-
111
-
112
-
113
-
114
-
115
-
116
-
117
-
118
-
119
-
120
-
121
-
122
-
123
-
124
-
125
-
126
-
127
-
128
-
129
-
130
-
131
-
132
-
133
-
134
-
135
-
136
-
137
-
138
-
139
-
140
-
141
-
142
-
143
-
144
-
145
-
146
-
147
-
148
-
149
-
150
-
151
-
152
-
153
-
154
-
155
-
156
-
157
-
158
-
159
-
160
-
161
-
162
-
163
-
164
-
165
-
166
-
167
-
168
-
169
-
170
-
171
-
172
-
173
-
174
-
175
-
176
-
177
-
178
-
179
-
180
-
181
-
182
-
183
-
184
-
185
-
186
-
187
-
188
-
189
-
190
-
191
-
192
-
193
-
194
-
195
-
196
-
197
-
198
-
199
-
200
-
201
-
202
-
203
-
204
-
205
-
206
-
207
-
208
-
209
-
210
-
211
-
212
-
213
-
214
-
215
-
216
-
217
-
218
-
219
-
220
-
221
-
222
-
223
-
224
-
225
-
226
-
227
-
228
-
229
-
230
-
231
-
232
-
233
-
234
-
235
-
236
-
237
-
238
-
239
-
240
-
241
-
242
-
243
-
244
-
245
-
246
-
247
-
248
-
249
-
250
-
251
-
252
-
253
-
 254
254 -
 255
255 -
 256
256 -
 257
257 -
 258
258 -
 259
259 -
 260
260 -
 261
261 -
 262
262 -
 263
263 -
 264
264 -
 265
265 -
 266
266 -
 267
267 -
 268
268 -
 269
269 -
 270
270 -
 271
271 -
 272
272 -
 273
273 -
 274
274 -
275
-
276
-
277
-
278
-
279
-
280
-
281
-
282
-
283
-
284
-
285
-
286
-
287
-
288
-
289
-
290
-
291
-
292
-
293
-
294
-
295
-
296
-
297
-
298
-
299
-
300
-
301
-
302
-
303
-
304
-
305
-
306
-
307
-
308
-
309
-
310
-
311
-
312
-
313
-
314
-
315
-
316
-
317
-
318
-
319
-
320
-
321
-
322
-
323
-
324
 |
 |
242
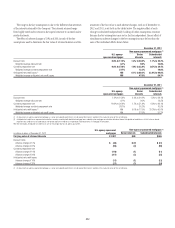
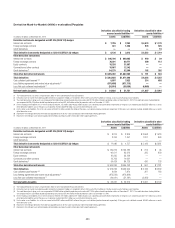
Derivative Notionals
Hedging instruments under
ASC 815 (SFAS 133) (1)(2) Other derivative instruments
Trading derivatives Management hedges (3)
In millions of dollars
December 31,
2012
December 31,
2011
December 31,
2012
December 31,
2011
December 31,
2012
December 31,
2011
Interest rate contracts
Swaps $114,296 $163,079 $30,050,856 $28,069,960 $ 99,434 $119,344
Futures and forwards ——4,823,370 3,549,642 45,856 43,965
Written options ——3,752,905 3,871,700 22,992 16,786
Purchased options ——3,542,048 3,888,415 7,890 7,338
Total interest rate contract notionals $114,296 $163,079 $42,169,179 $39,379,717 $176,172 $187,433
Foreign exchange contracts
Swaps $ 22,207 $ 27,575 $ 1,393,368 $ 1,182,363 $ 16,900 $ 22,458
Futures and forwards 70,484 55,211 3,484,193 3,191,687 33,768 31,095
Written options 96 4,292 781,698 591,818 989 190
Purchased options 456 39,163 778,438 583,891 2,106 53
Total foreign exchange contract notionals $ 93,243 $126,241 $ 6,437,697 $ 5,549,759 $ 53,763 $ 53,796
Equity contracts
Swaps $ — $ — $ 96,039 $ 86,978 $ — $ —
Futures and forwards ——16,171 12,882 ——
Written options ——320,243 552,333 ——
Purchased options ——281,236 509,322 ——
Total equity contract notionals $ — $ — $ 713,689 $ 1,161,515 $ — $ —
Commodity and other contracts
Swaps $ — $ — $ 27,323 $ 23,403 $ — $ —
Futures and forwards ——75,897 73,090 ——
Written options ——86,418 90,650 ——
Purchased options ——89,284 99,234 ——
Total commodity and other contract notionals $ — $ — $ 278,922 $ 286,377 $ — $ —
Credit derivatives (4)
Protection sold $ — $ — $ 1,346,494 $ 1,394,528 $ — $ —
Protection purchased 354 4,253 1,412,194 1,486,723 21,741 21,914
Total credit derivatives $ 354 $ 4,253 $ 2,758,688 $ 2,881,251 $ 21,741 $ 21,914
Total derivative notionals $207,893 $293,573 $52,358,175 $49,258,619 $251,676 $263,143
(1) The notional amounts presented in this table do not include hedge accounting relationships under ASC 815 (SFAS 133) where Citigroup is hedging the foreign currency risk of a net investment in a foreign operation by
issuing a foreign-currency-denominated debt instrument. The notional amount of such debt is $4,888 million and $7,060 million at December 31, 2012 and December 31, 2011, respectively.
(2) Derivatives in hedge accounting relationships accounted for under ASC 815 (SFAS 133) are recorded in either Other assets/Other liabilities or Trading account assets/Trading account liabilities on the Consolidated
Balance Sheet.
(3) Management hedges represent derivative instruments used in certain economic hedging relationships that are identified for management purposes, but for which hedge accounting is not applied. These derivatives are
recorded in either Other assets/Other liabilities or Trading account assets/Trading account liabilities on the Consolidated Balance Sheet.
(4) Credit derivatives are arrangements designed to allow one party (protection buyer) to transfer the credit risk of a “reference asset” to another party (protection seller). These arrangements allow a protection seller to
assume the credit risk associated with the reference asset without directly purchasing that asset. The Company has entered into credit derivative positions for purposes such as risk management, yield enhancement,
reduction of credit concentrations and diversification of overall risk.