Citibank 2012 Annual Report Download - page 278
Download and view the complete annual report
Please find page 278 of the 2012 Citibank annual report below. You can navigate through the pages in the report by either clicking on the pages listed below, or by using the keyword search tool below to find specific information within the annual report.-
 1
1 -
2
-
3
-
4
-
5
-
6
-
7
-
8
-
9
-
10
-
11
-
12
-
13
-
14
-
15
-
16
-
17
-
18
-
19
-
20
-
21
-
22
-
23
-
24
-
25
-
26
-
27
-
28
-
29
-
30
-
31
-
32
-
33
-
34
-
35
-
36
-
37
-
38
-
39
-
40
-
41
-
42
-
43
-
44
-
45
-
46
-
47
-
48
-
49
-
50
-
51
-
52
-
53
-
54
-
55
-
56
-
57
-
58
-
59
-
60
-
61
-
62
-
63
-
64
-
65
-
66
-
67
-
68
-
69
-
70
-
71
-
72
-
73
-
74
-
75
-
76
-
77
-
78
-
79
-
80
-
81
-
82
-
83
-
84
-
85
-
86
-
87
-
88
-
89
-
90
-
91
-
92
-
93
-
94
-
95
-
96
-
97
-
98
-
99
-
100
-
101
-
102
-
103
-
104
-
105
-
106
-
107
-
108
-
109
-
110
-
111
-
112
-
113
-
114
-
115
-
116
-
117
-
118
-
119
-
120
-
121
-
122
-
123
-
124
-
125
-
126
-
127
-
128
-
129
-
130
-
131
-
132
-
133
-
134
-
135
-
136
-
137
-
138
-
139
-
140
-
141
-
142
-
143
-
144
-
145
-
146
-
147
-
148
-
149
-
150
-
151
-
152
-
153
-
154
-
155
-
156
-
157
-
158
-
159
-
160
-
161
-
162
-
163
-
164
-
165
-
166
-
167
-
168
-
169
-
170
-
171
-
172
-
173
-
174
-
175
-
176
-
177
-
178
-
179
-
180
-
181
-
182
-
183
-
184
-
185
-
186
-
187
-
188
-
189
-
190
-
191
-
192
-
193
-
194
-
195
-
196
-
197
-
198
-
199
-
200
-
201
-
202
-
203
-
204
-
205
-
206
-
207
-
208
-
209
-
210
-
211
-
212
-
213
-
214
-
215
-
216
-
217
-
218
-
219
-
220
-
221
-
222
-
223
-
224
-
225
-
226
-
227
-
228
-
229
-
230
-
231
-
232
-
233
-
234
-
235
-
236
-
237
-
238
-
239
-
240
-
241
-
242
-
243
-
244
-
245
-
246
-
247
-
248
-
249
-
250
-
251
-
252
-
253
-
254
-
255
-
256
-
257
-
258
-
259
-
260
-
261
-
262
-
263
-
264
-
265
-
266
-
267
-
 268
268 -
 269
269 -
 270
270 -
 271
271 -
 272
272 -
 273
273 -
 274
274 -
 275
275 -
 276
276 -
 277
277 -
 278
278 -
 279
279 -
 280
280 -
 281
281 -
 282
282 -
 283
283 -
 284
284 -
 285
285 -
 286
286 -
 287
287 -
 288
288 -
289
-
290
-
291
-
292
-
293
-
294
-
295
-
296
-
297
-
298
-
299
-
300
-
301
-
302
-
303
-
304
-
305
-
306
-
307
-
308
-
309
-
310
-
311
-
312
-
313
-
314
-
315
-
316
-
317
-
318
-
319
-
320
-
321
-
322
-
323
-
324
 |
 |

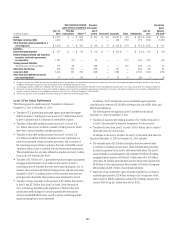
256
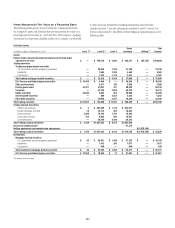
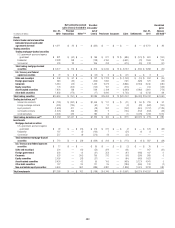
Fair Value Levels
In millions of dollars at December 31, 2011 Level 1 Level 2 Level 3
Gross
inventory Netting (1)
Net
balance
Assets
Federal funds sold and securities borrowed or purchased under
agreements to resell $ — $188,034 $ 4,701 $ 192,735 $ (49,873) $142,862
Trading securities
Trading mortgage-backed securities
U.S. government-sponsored agency guaranteed $ — $ 26,674 $ 861 $ 27,535 $ — $ 27,535
Residential — 1,362 1,509 2,871 — 2,871
Commercial — 1,715 618 2,333 — 2,333
Total trading mortgage-backed securities $ — $ 29,751 $ 2,988 $ 32,739 $ — $ 32,739
U.S. Treasury and federal agency securities $15,612 $ 3,784 $ 3 $ 19,399 $ — $ 19,399
State and municipal — 5,112 252 5,364 — 5,364
Foreign government 52,429 26,601 521 79,551 — 79,551
Corporate — 33,786 3,240 37,026 — 37,026
Equity securities 29,707 3,279 244 33,230 — 33,230
Asset-backed securities — 1,270 5,801 7,071 — 7,071
Other debt securities — 12,284 2,743 15,027 — 15,027
Total trading securities $97,748 $115,867 $15,792 $ 229,407 $ — $229,407
Trading account derivatives
Interest rate contracts $ 67 $755,473 $ 1,947 $ 757,487
Foreign exchange contracts — 93,536 781 94,317
Equity contracts 2,240 16,376 1,619 20,235
Commodity contracts 958 11,940 865 13,763
Credit derivatives — 81,123 9,301 90,424
Total trading account derivatives $ 3,265 $958,448 $14,513 $ 976,226
Gross cash collateral paid 57,815
Netting agreements and market value adjustments $ (971,714)
Total trading account derivatives $ 3,265 $958,448 $14,513 $1,034,041 $ (971,714) $ 62,327
Investments
Mortgage-backed securities
U.S. government-sponsored agency guaranteed $ 59 $ 45,043 $ 679 $ 45,781 $ — $ 45,781
Residential — 4,764 8 4,772 — 4,772
Commercial — 472 — 472 — 472
Total investment mortgage-backed securities $ 59 $ 50,279 $ 687 $ 51,025 $ — $ 51,025
U.S. Treasury and federal agency securities $11,642 $ 73,421 $ 75 $ 85,138 $ — $ 85,138
See footnotes on the next page.