Citibank 2012 Annual Report Download - page 265
Download and view the complete annual report
Please find page 265 of the 2012 Citibank annual report below. You can navigate through the pages in the report by either clicking on the pages listed below, or by using the keyword search tool below to find specific information within the annual report.-
 1
1 -
2
-
3
-
4
-
5
-
6
-
7
-
8
-
9
-
10
-
11
-
12
-
13
-
14
-
15
-
16
-
17
-
18
-
19
-
20
-
21
-
22
-
23
-
24
-
25
-
26
-
27
-
28
-
29
-
30
-
31
-
32
-
33
-
34
-
35
-
36
-
37
-
38
-
39
-
40
-
41
-
42
-
43
-
44
-
45
-
46
-
47
-
48
-
49
-
50
-
51
-
52
-
53
-
54
-
55
-
56
-
57
-
58
-
59
-
60
-
61
-
62
-
63
-
64
-
65
-
66
-
67
-
68
-
69
-
70
-
71
-
72
-
73
-
74
-
75
-
76
-
77
-
78
-
79
-
80
-
81
-
82
-
83
-
84
-
85
-
86
-
87
-
88
-
89
-
90
-
91
-
92
-
93
-
94
-
95
-
96
-
97
-
98
-
99
-
100
-
101
-
102
-
103
-
104
-
105
-
106
-
107
-
108
-
109
-
110
-
111
-
112
-
113
-
114
-
115
-
116
-
117
-
118
-
119
-
120
-
121
-
122
-
123
-
124
-
125
-
126
-
127
-
128
-
129
-
130
-
131
-
132
-
133
-
134
-
135
-
136
-
137
-
138
-
139
-
140
-
141
-
142
-
143
-
144
-
145
-
146
-
147
-
148
-
149
-
150
-
151
-
152
-
153
-
154
-
155
-
156
-
157
-
158
-
159
-
160
-
161
-
162
-
163
-
164
-
165
-
166
-
167
-
168
-
169
-
170
-
171
-
172
-
173
-
174
-
175
-
176
-
177
-
178
-
179
-
180
-
181
-
182
-
183
-
184
-
185
-
186
-
187
-
188
-
189
-
190
-
191
-
192
-
193
-
194
-
195
-
196
-
197
-
198
-
199
-
200
-
201
-
202
-
203
-
204
-
205
-
206
-
207
-
208
-
209
-
210
-
211
-
212
-
213
-
214
-
215
-
216
-
217
-
218
-
219
-
220
-
221
-
222
-
223
-
224
-
225
-
226
-
227
-
228
-
229
-
230
-
231
-
232
-
233
-
234
-
235
-
236
-
237
-
238
-
239
-
240
-
241
-
242
-
243
-
244
-
245
-
246
-
247
-
248
-
249
-
250
-
251
-
252
-
253
-
254
-
 255
255 -
 256
256 -
 257
257 -
 258
258 -
 259
259 -
 260
260 -
 261
261 -
 262
262 -
 263
263 -
 264
264 -
 265
265 -
 266
266 -
 267
267 -
 268
268 -
 269
269 -
 270
270 -
 271
271 -
 272
272 -
 273
273 -
 274
274 -
 275
275 -
276
-
277
-
278
-
279
-
280
-
281
-
282
-
283
-
284
-
285
-
286
-
287
-
288
-
289
-
290
-
291
-
292
-
293
-
294
-
295
-
296
-
297
-
298
-
299
-
300
-
301
-
302
-
303
-
304
-
305
-
306
-
307
-
308
-
309
-
310
-
311
-
312
-
313
-
314
-
315
-
316
-
317
-
318
-
319
-
320
-
321
-
322
-
323
-
324
 |
 |

243
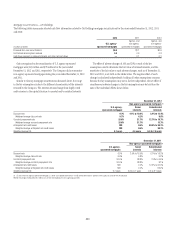
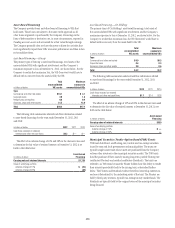
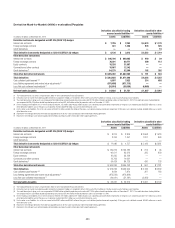
Derivative Mark-to-Market (Mt M) r eceivables/Payables
Derivatives classified in trading
account assets/liabilities (1)(2)
Derivatives classified in other
assets/liabilities (2)
In millions of dollars at December 31, 2012 Assets Liabilities Assets Liabilities
Derivative instruments designated as ASC 815 (SFAS 133) hedges
Interest rate contracts $ 7,795 $ 2,263 $ 4,574 $ 1,178
Foreign exchange contracts 341 1,350 978 525
Credit derivatives — — — 16
Total derivative instruments designated as ASC 815 (SFAS 133) hedges $ 8,136 $ 3,613 $ 5,552 $ 1,719
Other derivative instruments
Interest rate contracts $ 895,726 $ 890,405 $ 449 $ 29
Foreign exchange contracts 76,291 80,771 200 112
Equity contracts 18,293 31,867 — —
Commodity and other contracts 10,907 12,142 — —
Credit derivatives (3) 54,275 52,300 102 392
Total other derivative instruments $1,055,492 $1,067,485 $ 751 $ 533
Total derivatives $1,063,628 $1,071,098 $ 6,303 $ 2,252
Cash collateral paid/received (4)(5) 5,597 7,923 214 658
Less: Netting agreements and market value adjustments (6) (975,695) (971,715) — —
Less: Net cash collateral received/paid (7) (38,910) (55,555) (4,660) —
Net receivables/payables $ 54,620 $ 51,751 $ 1,857 $ 2,910
(1) The trading derivatives fair values are presented in Note 14 to the Consolidated Financial Statements.
(2) Derivative mark-to-market receivables/payables related to management hedges are recorded in either Other assets/Other liabilities or Trading account assets/Trading account liabilities.
(3) The credit derivatives trading assets are composed of $34,565 million related to protection purchased and $19,710 million related to protection sold as of December 31, 2012. The credit derivatives trading liabilities
are composed of $20,470 million related to protection purchased and $31,830 million related to protection sold as of December 31, 2012.
(4) For the trading assets/liabilities, this is the net amount of the $61,152 million and $46,833 million of gross cash collateral paid and received, respectively. Of the gross cash collateral paid, $55,555 million was used to
offset derivative liabilities and, of the gross cash collateral received, $38,910 million was used to offset derivative assets.
(5) For the other assets/liabilities, this is the net amount of the $214 million and $5,318 million of the gross cash collateral paid and received, respectively. Of the gross cash collateral received, $4,660 million was used to
offset derivative assets.
(6) Represents the netting of derivative receivable and payable balances for the same counterparty under enforceable netting agreements.
(7) Represents the netting of cash collateral paid and received by counterparty under enforceable credit support agreements.
Derivatives classified in trading
account assets/liabilities (1)(2)
Derivatives classified in other
assets/liabilities (2)
In millions of dollars at December 31, 2011 Assets Liabilities Assets Liabilities
Derivative instruments designated as ASC 815 (SFAS 133) hedges
Interest rate contracts $ 8,274 $ 3,306 $ 3,968 $1,518
Foreign exchange contracts 3,706 1,451 1,201 863
Credit derivatives — — — —
Total derivative instruments designated as ASC 815 (SFAS 133) hedges $ 11,980 $ 4,757 $ 5,169 $ 2,381
Other derivative instruments
Interest rate contracts $ 749,213 $ 736,785 $ 212 $ 96
Foreign exchange contracts 90,611 95,912 325 959
Equity contracts 20,235 33,139 — —
Commodity and other contracts 13,763 14,631 — —
Credit derivatives (3) 90,424 84,726 430 126
Total other derivative instruments $ 964,246 $ 965,193 $ 967 $ 1,181
Total derivatives $ 976,226 $ 969,950 $ 6,136 $ 3,562
Cash collateral paid/received (4)(5) 6,634 7,870 307 180
Less: Netting agreements and market value adjustments (6) (875,592) (870,366) — —
Less: Net cash collateral received/paid (7) (44,941) (51,181) (3,462) —
Net receivables/payables $ 62,327 $ 56,273 $ 2,981 $ 3,742
(1) The trading derivatives fair values are presented in Note 14 to the Consolidated Financial Statements.
(2) Derivative mark-to-market receivables/payables related to management hedges are recorded in either Other assets/Other liabilities or Trading account assets/Trading account liabilities.
(3) The credit derivatives trading assets are composed of $79,089 million related to protection purchased and $11,335 million related to protection sold as of December 31, 2011. The credit derivatives trading liabilities
are composed of $12,235 million related to protection purchased and $72,491 million related to protection sold as of December 31, 2011.
(4) For the trading assets/liabilities, this is the net amount of the $57,815 million and $52,811 million of gross cash collateral paid and received, respectively. Of the gross cash collateral paid, $51,181 million was used to
offset derivative liabilities and, of the gross cash collateral received, $44,941 million was used to offset derivative assets.
(5) For the other assets/liabilities, this is the net amount of the $307 million and $3,642 million of the gross cash collateral paid and received, respectively. Of the gross cash collateral received, $3,462 million was used to
offset derivative assets.
(6) Represents the netting of derivative receivable and payable balances for the same counterparty under enforceable netting agreements.
(7) Represents the netting of cash collateral paid and received by counterparty under enforceable credit support agreements.