Citibank 2012 Annual Report Download - page 31
Download and view the complete annual report
Please find page 31 of the 2012 Citibank annual report below. You can navigate through the pages in the report by either clicking on the pages listed below, or by using the keyword search tool below to find specific information within the annual report.-
 1
1 -
2
-
3
-
4
-
5
-
6
-
7
-
8
-
9
-
10
-
11
-
12
-
13
-
14
-
15
-
16
-
17
-
18
-
19
-
20
-
 21
21 -
 22
22 -
 23
23 -
 24
24 -
 25
25 -
 26
26 -
 27
27 -
 28
28 -
 29
29 -
 30
30 -
 31
31 -
 32
32 -
 33
33 -
 34
34 -
 35
35 -
 36
36 -
 37
37 -
 38
38 -
 39
39 -
 40
40 -
 41
41 -
42
-
43
-
44
-
45
-
46
-
47
-
48
-
49
-
50
-
51
-
52
-
53
-
54
-
55
-
56
-
57
-
58
-
59
-
60
-
61
-
62
-
63
-
64
-
65
-
66
-
67
-
68
-
69
-
70
-
71
-
72
-
73
-
74
-
75
-
76
-
77
-
78
-
79
-
80
-
81
-
82
-
83
-
84
-
85
-
86
-
87
-
88
-
89
-
90
-
91
-
92
-
93
-
94
-
95
-
96
-
97
-
98
-
99
-
100
-
101
-
102
-
103
-
104
-
105
-
106
-
107
-
108
-
109
-
110
-
111
-
112
-
113
-
114
-
115
-
116
-
117
-
118
-
119
-
120
-
121
-
122
-
123
-
124
-
125
-
126
-
127
-
128
-
129
-
130
-
131
-
132
-
133
-
134
-
135
-
136
-
137
-
138
-
139
-
140
-
141
-
142
-
143
-
144
-
145
-
146
-
147
-
148
-
149
-
150
-
151
-
152
-
153
-
154
-
155
-
156
-
157
-
158
-
159
-
160
-
161
-
162
-
163
-
164
-
165
-
166
-
167
-
168
-
169
-
170
-
171
-
172
-
173
-
174
-
175
-
176
-
177
-
178
-
179
-
180
-
181
-
182
-
183
-
184
-
185
-
186
-
187
-
188
-
189
-
190
-
191
-
192
-
193
-
194
-
195
-
196
-
197
-
198
-
199
-
200
-
201
-
202
-
203
-
204
-
205
-
206
-
207
-
208
-
209
-
210
-
211
-
212
-
213
-
214
-
215
-
216
-
217
-
218
-
219
-
220
-
221
-
222
-
223
-
224
-
225
-
226
-
227
-
228
-
229
-
230
-
231
-
232
-
233
-
234
-
235
-
236
-
237
-
238
-
239
-
240
-
241
-
242
-
243
-
244
-
245
-
246
-
247
-
248
-
249
-
250
-
251
-
252
-
253
-
254
-
255
-
256
-
257
-
258
-
259
-
260
-
261
-
262
-
263
-
264
-
265
-
266
-
267
-
268
-
269
-
270
-
271
-
272
-
273
-
274
-
275
-
276
-
277
-
278
-
279
-
280
-
281
-
282
-
283
-
284
-
285
-
286
-
287
-
288
-
289
-
290
-
291
-
292
-
293
-
294
-
295
-
296
-
297
-
298
-
299
-
300
-
301
-
302
-
303
-
304
-
305
-
306
-
307
-
308
-
309
-
310
-
311
-
312
-
313
-
314
-
315
-
316
-
317
-
318
-
319
-
320
-
321
-
322
-
323
-
324
 |
 |

9
The international RCB revenue growth year-over-year, excluding the
impact of FX translation, was driven by 9% revenue growth in Latin America
RCB and 2% revenue growth in EMEA RCB. Asia RCB revenues were flat
year-over-year, primarily reflecting spread compression in some countries
in the region and the impact of regulatory actions in certain countries,
particularly Korea. International RCB average deposits grew 2% versus the
prior year, average retail loans increased 11%, investment sales grew 12%,
average card loans grew 6%, and international card purchase sales grew 10%,
all excluding the impact of FX translation.
In Securities and Banking, fixed income markets revenues of
$14.0 billion, excluding CVA/DVA,7 increased 28% from the prior year,
reflecting higher revenues in rates and currencies and credit-related and
securitized products. Equity markets revenues of $2.4 billion in 2012,
excluding CVA/DVA, increased 1% driven by improved derivatives performance
as well as the absence in the current year of proprietary trading losses,
partially offset by lower cash equity volumes.
Investment banking revenues rose 10% from the prior year to $3.6 billion,
principally driven by higher revenues in debt underwriting and advisory
activities, partially offset by lower equity underwriting revenues. Lending
revenues of $997 million were down 45% from the prior year, reflecting
$698 million in losses on hedges related to accrual loans as credit spreads
tightened during 2012 (compared to a $519 million gain in the prior
year as spreads widened). Excluding the mark-to-market impact of loan
hedges related to accrual loans, lending revenues rose 31% year-over-year to
$1.7 billion reflecting growth in the Corporate loan portfolio and improved
spreads in most regions. Private Bank revenues of $2.3 billion increased 8%
from the prior year, excluding CVA/DVA, driven primarily by growth in North
America lending and deposits.
In Transaction Services, the increase in revenues year-over-year,
excluding the impact of FX translation, was driven by growth in Treasury
and Trade Solutions, which was partially offset by a decline in Securities
and Fund Services. Excluding the impact of FX translation, Treasury
and Trade Solutions revenues were up 8%, driven by growth in trade as
end-of-period trade loans grew 23%, partially offset by ongoing spread
compression given the low interest rate environment. Securities and Fund
Services revenues were down 2%, excluding the impact of FX translation,
mostly reflecting lower market volumes as well as spread compression
on deposits.
Citicorp end-of-period loans increased 7% year-over-year to $540 billion,
with 3% growth in Consumer loans, primarily in Latin America, and 11%
growth in Corporate loans.
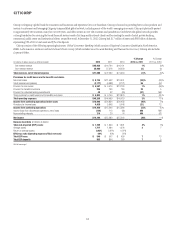
Citi Holdings8
Citi Holdings net loss was $6.6 billion compared to a net loss of $4.2 billion
in 2011. The increase in the net loss was driven by the $4.7 billion pretax
($2.9 billion after-tax) loss on MSSB described above. In addition, Citi
Holdings results included $77 million in repositioning charges in the
fourth quarter of 2012, compared to $60 million in the fourth quarter of
2011. Excluding the loss on MSSB, CVA/DVA9 and the repositioning charges
in the fourth quarters of 2012 and 2011, Citi Holdings net loss decreased
to $3.7 billion compared to a net loss of $4.2 billion in the prior year, as
revenue declines and lower loan loss reserve releases were more than offset by
lower operating expenses and lower net credit losses. These improved results
in 2012 reflected the continued decline in Citi Holdings assets.
Citi Holdings revenues decreased to $(833) million from $6.3 billion
in the prior year. Excluding CVA/DVA and the loss on MSSB, Citi Holdings
revenues were $3.7 billion in 2012 compared to $6.2 billion in the prior year.
Special Asset Pool revenues, excluding CVA/DVA, were $(657) million in 2012,
compared to $473 million in the prior year, largely due to lower non-interest
revenue resulting from lower gains on asset sales. Local Consumer Lending
revenues of $4.4 billion declined 20% from the prior year primarily due to the
24% decline in average assets. Brokerage and Asset Management revenues,
excluding the loss on MSSB, were $(15) million, compared to $282 million
in the prior year, mostly reflecting higher funding costs. Net interest revenues
declined 30% year-over-year to $2.6 billion, largely driven by continued
declining loan balances in Local Consumer Lending. Non-interest
revenues, excluding the loss on MSSB and CVA/DVA, were $1.1 billion versus
$2.5 billion in the prior year, principally reflecting lower gains on asset sales
within the Special Asset Pool.
As noted above, Citi Holdings assets declined 31% year-over-year to
$156 billion as of the end of 2012. Also at the end of 2012, Citi Holdings
assets comprised approximately 8% of total Citigroup GAAP assets and 15%
of risk-weighted assets (as defined under current regulatory guidelines).
Local Consumer Lending continued to represent the largest segment
within Citi Holdings, with $126 billion of assets as of the end of 2012, of
which approximately 73% consisted of mortgages in North America real
estate lending.
8 Citi Holdings includes Local Consumer Lending, Special Asset Pool and Brokerage and Asset
Management. See “Citi Holdings” below for additional information on the results of operations for each
of the businesses in Citi Holdings.
9 CVA/DVA in Citi Holdings, recorded in the Special Asset Pool, was $157 million in 2012, compared to
$74 million in the prior year.
7 For the summary of CVA/DVA by business within Securities and Banking for 2012 and comparable
periods, see “Citicorp—Institutional Clients Group.”