Citibank 2012 Annual Report Download - page 224
Download and view the complete annual report
Please find page 224 of the 2012 Citibank annual report below. You can navigate through the pages in the report by either clicking on the pages listed below, or by using the keyword search tool below to find specific information within the annual report.-
 1
1 -
2
-
3
-
4
-
5
-
6
-
7
-
8
-
9
-
10
-
11
-
12
-
13
-
14
-
15
-
16
-
17
-
18
-
19
-
20
-
21
-
22
-
23
-
24
-
25
-
26
-
27
-
28
-
29
-
30
-
31
-
32
-
33
-
34
-
35
-
36
-
37
-
38
-
39
-
40
-
41
-
42
-
43
-
44
-
45
-
46
-
47
-
48
-
49
-
50
-
51
-
52
-
53
-
54
-
55
-
56
-
57
-
58
-
59
-
60
-
61
-
62
-
63
-
64
-
65
-
66
-
67
-
68
-
69
-
70
-
71
-
72
-
73
-
74
-
75
-
76
-
77
-
78
-
79
-
80
-
81
-
82
-
83
-
84
-
85
-
86
-
87
-
88
-
89
-
90
-
91
-
92
-
93
-
94
-
95
-
96
-
97
-
98
-
99
-
100
-
101
-
102
-
103
-
104
-
105
-
106
-
107
-
108
-
109
-
110
-
111
-
112
-
113
-
114
-
115
-
116
-
117
-
118
-
119
-
120
-
121
-
122
-
123
-
124
-
125
-
126
-
127
-
128
-
129
-
130
-
131
-
132
-
133
-
134
-
135
-
136
-
137
-
138
-
139
-
140
-
141
-
142
-
143
-
144
-
145
-
146
-
147
-
148
-
149
-
150
-
151
-
152
-
153
-
154
-
155
-
156
-
157
-
158
-
159
-
160
-
161
-
162
-
163
-
164
-
165
-
166
-
167
-
168
-
169
-
170
-
171
-
172
-
173
-
174
-
175
-
176
-
177
-
178
-
179
-
180
-
181
-
182
-
183
-
184
-
185
-
186
-
187
-
188
-
189
-
190
-
191
-
192
-
193
-
194
-
195
-
196
-
197
-
198
-
199
-
200
-
201
-
202
-
203
-
204
-
205
-
206
-
207
-
208
-
209
-
210
-
211
-
212
-
213
-
 214
214 -
 215
215 -
 216
216 -
 217
217 -
 218
218 -
 219
219 -
 220
220 -
 221
221 -
 222
222 -
 223
223 -
 224
224 -
 225
225 -
 226
226 -
 227
227 -
 228
228 -
 229
229 -
 230
230 -
 231
231 -
 232
232 -
 233
233 -
 234
234 -
235
-
236
-
237
-
238
-
239
-
240
-
241
-
242
-
243
-
244
-
245
-
246
-
247
-
248
-
249
-
250
-
251
-
252
-
253
-
254
-
255
-
256
-
257
-
258
-
259
-
260
-
261
-
262
-
263
-
264
-
265
-
266
-
267
-
268
-
269
-
270
-
271
-
272
-
273
-
274
-
275
-
276
-
277
-
278
-
279
-
280
-
281
-
282
-
283
-
284
-
285
-
286
-
287
-
288
-
289
-
290
-
291
-
292
-
293
-
294
-
295
-
296
-
297
-
298
-
299
-
300
-
301
-
302
-
303
-
304
-
305
-
306
-
307
-
308
-
309
-
310
-
311
-
312
-
313
-
314
-
315
-
316
-
317
-
318
-
319
-
320
-
321
-
322
-
323
-
324
 |
 |

202
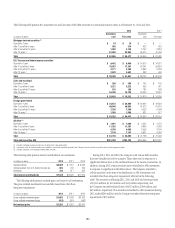
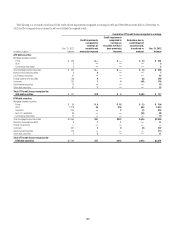
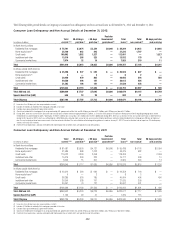
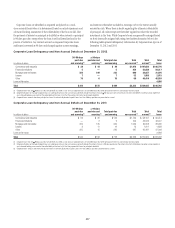
The following tables provide details on Citigroup’s Consumer loan delinquency and non-accrual loans as of December 31, 2012 and December 31, 2011:
Consumer Loan Delinquency and Non-Accrual Details at December 31, 2012
In millions of dollars
Total
current (1)(2)
30–89 days
past due (3)
≥ 90 days
past due (3)
Past due
Government
guaranteed (4)
Total
loans (2)
Total
non-accrual (5)
90 days past due
and accruing
In North America offices
Residential first mortgages $ 75,791 $ 3,074 $3,339 $6,000 $ 88,204 $4,922 $ 4,695
Home equity loans (6) 35,740 642 843 — 37,225 1,797 —
Credit cards 108,892 1,582 1,527 — 112,001 — 1,527
Installment and other 13,319 288 325 — 13,932 179 8
Commercial market loans 7,874 32 19 — 7,925 210 11
Total $241,616 $ 5,618 $6,053 $6,000 $259,287 $ 7,108 $6,241
In offices outside North America
Residential first mortgages $ 45,496 $ 547 $ 485 $ — $ 46,528 $ 807 $ —
Home equity loans (6) 4 — 2 — 6 2 —
Credit cards 38,920 970 805 — 40,695 516 508
Installment and other 29,350 496 167 — 30,013 254 —
Commercial market loans 31,263 106 181 — 31,550 428 —
Total $145,033 $ 2,119 $1,640 $ — $148,792 $ 2,007 $ 508
Total GCB and LCL $386,649 $7,737 $7,693 $ 6,000 $408,079 $ 9,115 $6,749
Special Asset Pool (SAP) 545 18 29 — 592 81 —
Total Citigroup $387,194 $7,755 $7,722 $ 6,000 $408,671 $ 9,196 $6,749
(1) Loans less than 30 days past due are presented as current.
(2) Includes $1.2 billion of residential first mortgages recorded at fair value.
(3) Excludes loans guaranteed by U.S. government entities.
(4) Consists of residential first mortgages that are guaranteed by U.S. government entities that are 30-89 days past due of $1.3 billion and ≥ 90 days past due of $4.7 billion.
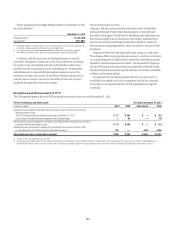
(5) During 2012, there was an increase in Consumer non-accrual loans in North America of approximately $1.5 billion, as a result of OCC guidance issued in the third quarter of 2012 regarding mortgage loans where
the borrower has gone through Chapter 7 bankruptcy. Of the $1.5 billion non-accrual loans, $1.3 billion were current. Additionally, during 2012, there was an increase in non-accrual Consumer loans in North America
during the first quarter of 2012, which was attributable to a $0.8 billion reclassification from accrual to non-accrual status of home equity loans where the related residential first mortgage was 90 days or more past
due. The vast majority of these loans were current at the time of reclassification. The reclassification reflected regulatory guidance issued on January 31, 2012. The reclassification had no impact on Citi’s delinquency
statistics or its loan loss reserves.
(6) Fixed rate home equity loans and loans extended under home equity lines of credit, which are typically in junior lien positions.
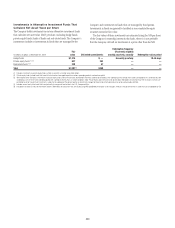
Consumer Loan Delinquency and Non-Accrual Details at December 31, 2011
In millions of dollars
Total
current (1)(2)
30–89 days
past due (3)
≥ 90 days
past due (3)
Past due
Government
guaranteed (4)
Total
loans (2)
Total
non-accrual
90 days past due
and accruing
In North America offices
Residential first mortgages $ 81,081 $ 3,550 $ 4,121 $6,686 $ 95,438 $4,176 $ 5,054
Home equity loans (5) 41,585 868 1,022 — 43,475 982 —
Credit cards 114,022 2,344 2,058 — 118,424 — 2,058
Installment and other 15,215 340 222 — 15,777 438 10
Commercial market loans 6,643 15 207 — 6,865 220 14
Total $258,546 $ 7,117 $ 7,630 $ 6,686 $279,979 $ 5,816 $ 7,136
In offices outside North America
Residential first mortgages $ 43,310 $ 566 $ 482 $ — $ 44,358 $ 744 $ —
Home equity loans (5) 6 — 2 — 8 2 —
Credit cards 38,289 930 785 — 40,004 496 490
Installment and other 26,300 528 197 — 27,025 258 —
Commercial market loans 30,491 79 127 — 30,697 401 —
Total $138,396 $ 2,103 $ 1,593 $ — $142,092 $ 1,901 $ 490
Total GCB and LCL $396,942 $ 9,220 $ 9,223 $ 6,686 $422,071 $ 7,717 $ 7,626
Special Asset Pool (SAP) 1,193 29 47 — 1,269 115 —
Total Citigroup $398,135 $ 9,249 $ 9,270 $ 6,686 $423,340 $ 7,832 $ 7,626
(1) Loans less than 30 days past due are presented as current.
(2) Includes $1.3 billion of residential first mortgages recorded at fair value.
(3) Excludes loans guaranteed by U.S. government entities.
(4) Consists of residential first mortgages that are guaranteed by U.S. government entities that are 30-89 days past due of $1.6 billion and ≥ 90 days past due of $5.1 billion.
(5) Fixed rate home equity loans and loans extended under home equity lines of credit, which are typically in junior lien positions.