Citibank 2012 Annual Report Download - page 234
Download and view the complete annual report
Please find page 234 of the 2012 Citibank annual report below. You can navigate through the pages in the report by either clicking on the pages listed below, or by using the keyword search tool below to find specific information within the annual report.-
 1
1 -
2
-
3
-
4
-
5
-
6
-
7
-
8
-
9
-
10
-
11
-
12
-
13
-
14
-
15
-
16
-
17
-
18
-
19
-
20
-
21
-
22
-
23
-
24
-
25
-
26
-
27
-
28
-
29
-
30
-
31
-
32
-
33
-
34
-
35
-
36
-
37
-
38
-
39
-
40
-
41
-
42
-
43
-
44
-
45
-
46
-
47
-
48
-
49
-
50
-
51
-
52
-
53
-
54
-
55
-
56
-
57
-
58
-
59
-
60
-
61
-
62
-
63
-
64
-
65
-
66
-
67
-
68
-
69
-
70
-
71
-
72
-
73
-
74
-
75
-
76
-
77
-
78
-
79
-
80
-
81
-
82
-
83
-
84
-
85
-
86
-
87
-
88
-
89
-
90
-
91
-
92
-
93
-
94
-
95
-
96
-
97
-
98
-
99
-
100
-
101
-
102
-
103
-
104
-
105
-
106
-
107
-
108
-
109
-
110
-
111
-
112
-
113
-
114
-
115
-
116
-
117
-
118
-
119
-
120
-
121
-
122
-
123
-
124
-
125
-
126
-
127
-
128
-
129
-
130
-
131
-
132
-
133
-
134
-
135
-
136
-
137
-
138
-
139
-
140
-
141
-
142
-
143
-
144
-
145
-
146
-
147
-
148
-
149
-
150
-
151
-
152
-
153
-
154
-
155
-
156
-
157
-
158
-
159
-
160
-
161
-
162
-
163
-
164
-
165
-
166
-
167
-
168
-
169
-
170
-
171
-
172
-
173
-
174
-
175
-
176
-
177
-
178
-
179
-
180
-
181
-
182
-
183
-
184
-
185
-
186
-
187
-
188
-
189
-
190
-
191
-
192
-
193
-
194
-
195
-
196
-
197
-
198
-
199
-
200
-
201
-
202
-
203
-
204
-
205
-
206
-
207
-
208
-
209
-
210
-
211
-
212
-
213
-
214
-
215
-
216
-
217
-
218
-
219
-
220
-
221
-
222
-
223
-
 224
224 -
 225
225 -
 226
226 -
 227
227 -
 228
228 -
 229
229 -
 230
230 -
 231
231 -
 232
232 -
 233
233 -
 234
234 -
 235
235 -
 236
236 -
 237
237 -
 238
238 -
 239
239 -
 240
240 -
 241
241 -
 242
242 -
 243
243 -
 244
244 -
245
-
246
-
247
-
248
-
249
-
250
-
251
-
252
-
253
-
254
-
255
-
256
-
257
-
258
-
259
-
260
-
261
-
262
-
263
-
264
-
265
-
266
-
267
-
268
-
269
-
270
-
271
-
272
-
273
-
274
-
275
-
276
-
277
-
278
-
279
-
280
-
281
-
282
-
283
-
284
-
285
-
286
-
287
-
288
-
289
-
290
-
291
-
292
-
293
-
294
-
295
-
296
-
297
-
298
-
299
-
300
-
301
-
302
-
303
-
304
-
305
-
306
-
307
-
308
-
309
-
310
-
311
-
312
-
313
-
314
-
315
-
316
-
317
-
318
-
319
-
320
-
321
-
322
-
323
-
324
 |
 |

212
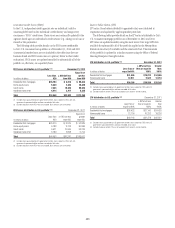
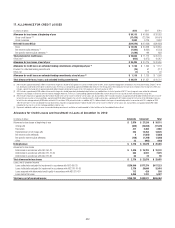
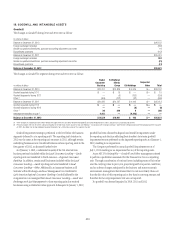
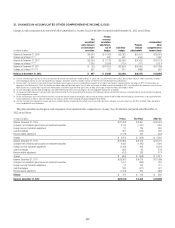
17. ALLOWANCE FOR CREDIT LOSSES
In millions of dollars 2012 2011 2010
Allowance for loan losses at beginning of year $ 30,115 $40,655 $ 36,033
Gross credit losses (1)(2) (17,478) (23,164) (34,491)
Gross recoveries 2,902 3,126 3,632
Net credit losses (NCLs) $(14,576) $ (20,038) $ (30,859)
NCLs $ 14,576 $ 20,038 $ 30,859
Net reserve builds (releases) (1) (1,882) (8,434) (6,523)
Net specific reserve builds (releases) (2) (1,846) 169 858
Total provision for credit losses $ 10,848 $ 11,773 $ 25,194
Other, net (3) (932) (2,275) 10,287
Allowance for loan losses at end of year $ 25,455 $ 30,115 $ 40,655
Allowance for credit losses on unfunded lending commitments at beginning of year (4) $ 1,136 $ 1,066 $ 1,157
Provision for unfunded lending commitments (16) 51 (117)
Other, net (1) 19 26
Allowance for credit losses on unfunded lending commitments at end of year (4) $ 1,119 $ 1,136 $ 1,066
Total allowance for loans, leases, and unfunded lending commitments $ 26,574 $ 31,251 $ 41,721
(1) 2012 includes approximately $635 million of incremental charge-offs related to OCC guidance issued in the third quarter of 2012, which required mortgage loans to borrowers that have gone through Chapter 7 of the
U.S. Bankruptcy Code to be written down to collateral value. There was a corresponding approximate $600 million release in the third quarter of 2012 allowance for loan losses related to these charge-offs. 2012 also
includes a benefit to charge-offs of approximately $40 million related to finalizing the impact of this OCC guidance in the fourth quarter of 2012.
(2) 2012 includes approximately $370 million of incremental charge-offs related to previously deferred principal balances on modified loans in the first quarter of 2012. These charge-offs were related to anticipated
forgiveness of principal in connection with the national mortgage settlement. There was a corresponding approximate $350 million reserve release in the first quarter of 2012 related to these charge-offs.
(3) 2012 includes reductions of approximately $875 million related to the sale or transfer to held-for-sale of various U.S. loan portfolios. 2011 includes reductions of approximately $1.6 billion related to the sale or transfer
to held-for-sale of various U.S. loan portfolios, approximately $240 million related to the sale of the Egg Banking PLC credit card business, approximately $72 million related to the transfer of the Citi Belgium business
to held-for-sale and approximately $290 million related to FX translation. 2010 primarily includes an addition of $13.4 billion related to the impact of consolidating entities in connection with Citi’s adoption of SFAS
166/167 (see Note 1 to the Consolidated Financial Statements), reductions of approximately $2.7 billion related to the sale or transfer to held-for-sale of various U.S. loan portfolios and approximately $290 million
related to the transfer of a U.K. first mortgage portfolio to held-for-sale.
(4) Represents additional credit loss reserves for unfunded lending commitments and letters of credit recorded in Other liabilities on the Consolidated Balance Sheet.
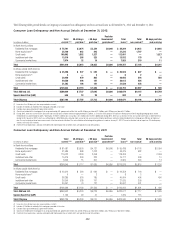
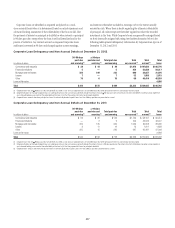
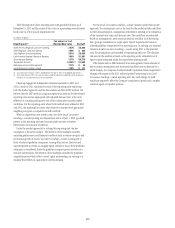
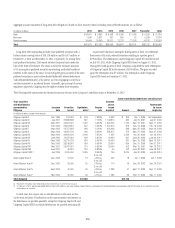
Allowance for Credit Losses and Investment in Loans at December 31, 2012
In millions of dollars Corporate Consumer Total
Allowance for loan losses at beginning of year $ 2,879 $ 27,236 $ 30,115
Charge-offs (640) (16,838) (17,478)
Recoveries 417 2,485 2,902
Replenishment of net charge-offs 223 14,353 14,576
Net reserve builds (releases) 2 (1,884) (1,882)
Net specific reserve builds (releases) (138) (1,708) (1,846)
Other 33 (965) (932)
Ending balance $ 2,776 $ 22,679 $ 25,455
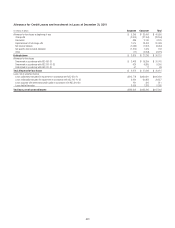
Allowance for loan losses
Determined in accordance with ASC 450-20 $ 2,429 $ 15,703 $ 18,132
Determined in accordance with ASC 310-10-35 284 6,941 7,225
Determined in accordance with ASC 310-30 63 35 98
Total allowance for loan losses $ 2,776 $ 22,679 $ 25,455
Loans, net of unearned income
Loans collectively evaluated for impairment in accordance with ASC 450-20 $239,849 $377,374 $617,223
Loans individually evaluated for impairment in accordance with ASC 310-10-35 2,776 29,640 32,416
Loans acquired with deteriorated credit quality in accordance with ASC 310-30 112 426 538
Loans held at fair value 4,056 1,231 5,287
Total loans, net of unearned income $246,793 $408,671 $655,464