Citibank 2012 Annual Report Download - page 51
Download and view the complete annual report
Please find page 51 of the 2012 Citibank annual report below. You can navigate through the pages in the report by either clicking on the pages listed below, or by using the keyword search tool below to find specific information within the annual report.-
 1
1 -
2
-
3
-
4
-
5
-
6
-
7
-
8
-
9
-
10
-
11
-
12
-
13
-
14
-
15
-
16
-
17
-
18
-
19
-
20
-
21
-
22
-
23
-
24
-
25
-
26
-
27
-
28
-
29
-
30
-
31
-
32
-
33
-
34
-
35
-
36
-
37
-
38
-
39
-
40
-
 41
41 -
 42
42 -
 43
43 -
 44
44 -
 45
45 -
 46
46 -
 47
47 -
 48
48 -
 49
49 -
 50
50 -
 51
51 -
 52
52 -
 53
53 -
 54
54 -
 55
55 -
 56
56 -
 57
57 -
 58
58 -
 59
59 -
 60
60 -
 61
61 -
62
-
63
-
64
-
65
-
66
-
67
-
68
-
69
-
70
-
71
-
72
-
73
-
74
-
75
-
76
-
77
-
78
-
79
-
80
-
81
-
82
-
83
-
84
-
85
-
86
-
87
-
88
-
89
-
90
-
91
-
92
-
93
-
94
-
95
-
96
-
97
-
98
-
99
-
100
-
101
-
102
-
103
-
104
-
105
-
106
-
107
-
108
-
109
-
110
-
111
-
112
-
113
-
114
-
115
-
116
-
117
-
118
-
119
-
120
-
121
-
122
-
123
-
124
-
125
-
126
-
127
-
128
-
129
-
130
-
131
-
132
-
133
-
134
-
135
-
136
-
137
-
138
-
139
-
140
-
141
-
142
-
143
-
144
-
145
-
146
-
147
-
148
-
149
-
150
-
151
-
152
-
153
-
154
-
155
-
156
-
157
-
158
-
159
-
160
-
161
-
162
-
163
-
164
-
165
-
166
-
167
-
168
-
169
-
170
-
171
-
172
-
173
-
174
-
175
-
176
-
177
-
178
-
179
-
180
-
181
-
182
-
183
-
184
-
185
-
186
-
187
-
188
-
189
-
190
-
191
-
192
-
193
-
194
-
195
-
196
-
197
-
198
-
199
-
200
-
201
-
202
-
203
-
204
-
205
-
206
-
207
-
208
-
209
-
210
-
211
-
212
-
213
-
214
-
215
-
216
-
217
-
218
-
219
-
220
-
221
-
222
-
223
-
224
-
225
-
226
-
227
-
228
-
229
-
230
-
231
-
232
-
233
-
234
-
235
-
236
-
237
-
238
-
239
-
240
-
241
-
242
-
243
-
244
-
245
-
246
-
247
-
248
-
249
-
250
-
251
-
252
-
253
-
254
-
255
-
256
-
257
-
258
-
259
-
260
-
261
-
262
-
263
-
264
-
265
-
266
-
267
-
268
-
269
-
270
-
271
-
272
-
273
-
274
-
275
-
276
-
277
-
278
-
279
-
280
-
281
-
282
-
283
-
284
-
285
-
286
-
287
-
288
-
289
-
290
-
291
-
292
-
293
-
294
-
295
-
296
-
297
-
298
-
299
-
300
-
301
-
302
-
303
-
304
-
305
-
306
-
307
-
308
-
309
-
310
-
311
-
312
-
313
-
314
-
315
-
316
-
317
-
318
-
319
-
320
-
321
-
322
-
323
-
324
 |
 |
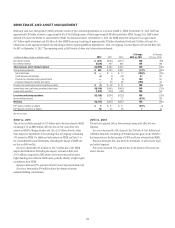
29
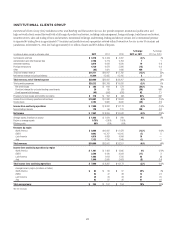
The discussion of the results of operations for Transaction Services below excludes the impact of FX translation for all periods presented. Presentation
of the results of operations, excluding the impact of FX translation, are non-GAAP financial measures. Citi believes the presentation of Transaction
Services’ results excluding the impact of FX translation is a more meaningful depiction of the underlying fundamentals of the business. For a
reconciliation of certain of these metrics to the reported results, see the table above.
2012 vs. 2011
Net income increased 10%, reflecting growth in revenues, partially offset by
higher expenses and credit costs.
Revenues increased 5% as higher trade loan and deposit balances
were partially offset by continued spread compression and lower market
volumes. Treasury and Trade Solutions revenues were up 8%, driven by
growth in trade as end-of-period trade loans grew 23%. Cash management
revenues also grew, reflecting growth in deposit balances and fees, partially
offset by continued spread compression due to the continued low interest
rate environment. Securities and Fund Services revenues decreased 2%,
primarily driven by lower market volumes as well as spread compression on
deposits. Citi expects spread compression will continue to negatively impact
Transaction Services.
Expenses increased 2%. Excluding repositioning charges of $134 million
in 2012 (including $95 million in the fourth quarter of 2012) compared
to $60 million in 2011, expenses were flat, primarily driven by incremental
investment spending and higher legal and related costs, offset by
efficiency savings.
Average deposits and other customer liabilities grew 13%, driven by
focused deposit building activities as well as continued market demand
for U.S. dollar deposits (for additional information on Citi’s deposits, see
“Capital Resources and Liquidity—Funding and Liquidity” below).
2011 vs. 2010
Net income decreased 11%, as higher expenses, driven by investment
spending, outpaced revenue growth.
Revenues grew 3%, driven primarily by international growth, as
improvement in fees and increased deposit balances more than offset the
continued spread compression. Treasury and Trade Solutions revenues
increased 4%, driven primarily by growth in the trade and commercial
cards businesses and increased deposits, partially offset by the impact of
the continued low rate environment. Securities and Fund Services revenues
increased 1%, primarily due to growth in transaction and settlement
volumes, driven in part by the increase in activity resulting from market
volatility, and new client mandates.
Expenses increased 14%, reflecting investment spending and higher
business volumes, partially offset by productivity savings.
Average deposits and other customer liabilities grew 7% and included
the shift to operating balances as the business continued to emphasize
more stable, lower cost deposits as a way to mitigate spread compression
(for additional information on Citi’s deposits, see “Capital Resources and
Liquidity—Funding and Liquidity” below).