Citibank 2012 Annual Report Download - page 205
Download and view the complete annual report
Please find page 205 of the 2012 Citibank annual report below. You can navigate through the pages in the report by either clicking on the pages listed below, or by using the keyword search tool below to find specific information within the annual report.-
 1
1 -
 2
2 -
 3
3 -
 4
4 -
 5
5 -
 6
6 -
 7
7 -
 8
8 -
 9
9 -
 10
10 -
 11
11 -
 12
12 -
 13
13 -
 14
14 -
 15
15 -
 16
16 -
 17
17 -
 18
18 -
 19
19 -
 20
20 -
 21
21 -
 22
22 -
 23
23 -
 24
24 -
 25
25 -
 26
26 -
 27
27 -
 28
28 -
 29
29 -
 30
30 -
 31
31 -
 32
32 -
 33
33 -
 34
34 -
 35
35 -
 36
36 -
 37
37 -
 38
38 -
 39
39 -
 40
40 -
 41
41 -
 42
42 -
 43
43 -
 44
44 -
 45
45 -
 46
46 -
 47
47 -
 48
48 -
 49
49 -
 50
50 -
 51
51 -
 52
52 -
 53
53 -
 54
54 -
 55
55 -
 56
56 -
 57
57 -
 58
58 -
 59
59 -
 60
60 -
 61
61 -
 62
62 -
 63
63 -
 64
64 -
 65
65 -
 66
66 -
 67
67 -
 68
68 -
 69
69 -
 70
70 -
 71
71 -
 72
72 -
 73
73 -
 74
74 -
 75
75 -
 76
76 -
 77
77 -
 78
78 -
 79
79 -
 80
80 -
 81
81 -
 82
82 -
 83
83 -
 84
84 -
 85
85 -
 86
86 -
 87
87 -
 88
88 -
 89
89 -
 90
90 -
 91
91 -
 92
92 -
 93
93 -
 94
94 -
 95
95 -
 96
96 -
 97
97 -
 98
98 -
 99
99 -
 100
100 -
 101
101 -
 102
102 -
 103
103 -
 104
104 -
 105
105 -
 106
106 -
 107
107 -
 108
108 -
 109
109 -
 110
110 -
 111
111 -
 112
112 -
 113
113 -
 114
114 -
 115
115 -
 116
116 -
 117
117 -
 118
118 -
 119
119 -
 120
120 -
 121
121 -
 122
122 -
 123
123 -
 124
124 -
 125
125 -
 126
126 -
 127
127 -
 128
128 -
 129
129 -
 130
130 -
 131
131 -
 132
132 -
 133
133 -
 134
134 -
 135
135 -
 136
136 -
 137
137 -
 138
138 -
 139
139 -
 140
140 -
 141
141 -
 142
142 -
 143
143 -
 144
144 -
 145
145 -
 146
146 -
 147
147 -
 148
148 -
 149
149 -
 150
150 -
 151
151 -
 152
152 -
 153
153 -
 154
154 -
 155
155 -
 156
156 -
 157
157 -
 158
158 -
 159
159 -
 160
160 -
 161
161 -
 162
162 -
 163
163 -
 164
164 -
 165
165 -
 166
166 -
 167
167 -
 168
168 -
 169
169 -
 170
170 -
 171
171 -
 172
172 -
 173
173 -
 174
174 -
 175
175 -
 176
176 -
 177
177 -
 178
178 -
 179
179 -
 180
180 -
 181
181 -
 182
182 -
 183
183 -
 184
184 -
 185
185 -
 186
186 -
 187
187 -
 188
188 -
 189
189 -
 190
190 -
 191
191 -
 192
192 -
 193
193 -
 194
194 -
 195
195 -
 196
196 -
 197
197 -
 198
198 -
 199
199 -
 200
200 -
 201
201 -
 202
202 -
 203
203 -
 204
204 -
 205
205 -
 206
206 -
 207
207 -
 208
208 -
 209
209 -
 210
210 -
 211
211 -
 212
212 -
 213
213 -
 214
214 -
 215
215 -
 216
216 -
 217
217 -
 218
218 -
 219
219 -
 220
220 -
 221
221 -
 222
222 -
 223
223 -
 224
224 -
 225
225 -
 226
226 -
 227
227 -
 228
228 -
 229
229 -
 230
230 -
 231
231 -
 232
232 -
 233
233 -
 234
234 -
 235
235 -
 236
236 -
 237
237 -
 238
238 -
 239
239 -
 240
240 -
 241
241 -
 242
242 -
 243
243 -
 244
244 -
 245
245 -
 246
246 -
 247
247 -
 248
248 -
 249
249 -
 250
250 -
 251
251 -
 252
252 -
 253
253 -
 254
254 -
 255
255 -
 256
256 -
 257
257 -
 258
258 -
 259
259 -
 260
260 -
 261
261 -
 262
262 -
 263
263 -
 264
264 -
 265
265 -
 266
266 -
 267
267 -
 268
268 -
 269
269 -
 270
270 -
 271
271 -
 272
272 -
 273
273 -
 274
274 -
 275
275 -
 276
276 -
 277
277 -
 278
278 -
 279
279 -
 280
280 -
 281
281 -
 282
282 -
 283
283 -
 284
284 -
 285
285 -
 286
286 -
 287
287 -
 288
288 -
 289
289 -
 290
290 -
 291
291 -
 292
292 -
 293
293 -
 294
294 -
 295
295 -
 296
296 -
 297
297 -
 298
298 -
 299
299 -
 300
300 -
 301
301 -
 302
302 -
 303
303 -
 304
304 -
 305
305 -
 306
306 -
 307
307 -
 308
308 -
 309
309 -
 310
310 -
 311
311 -
 312
312 -
 313
313 -
 314
314 -
 315
315 -
 316
316 -
 317
317 -
 318
318 -
 319
319 -
 320
320 -
 321
321 -
 322
322 -
 323
323 -
 324
324
 |
 |

183
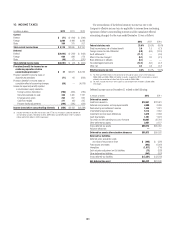
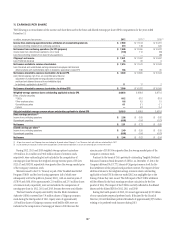
10. INCOME TAXES
In millions of dollars 2012 2011 2010
Current
Federal $ (71) $ (144) $ (249)
Foreign 3,889 3,498 3,239
State 300 241 207
Total current income taxes $ 4,118 $3,595 $ 3,197
Deferred
Federal $(4,943) $ (793) $ (933)
Foreign 900 628 279
State (48) 91 (310)
Total deferred income taxes $(4,091) $ (74) $ (964)
Provision (benefit) for income tax on
continuing operations before
noncontrolling interests (1) $ 27 $3,521 $ 2,233
Provision (benefit) for income taxes on
discontinued operations (71) 66 (562)
Provision (benefit) for income taxes on
cumulative effect of accounting changes (58) — (4,978)
Income tax expense (benefit) reported
in stockholders’ equity related to:
Foreign currency translation (709) (609) (739)
Securities available-for-sale 369 1,495 1,167
Employee stock plans 265 297 600
Cash flow hedges 311 (92) 325
Pension liability adjustments (390) (235) (434)
Income taxes before noncontrolling interests $ (256) $4,443 $(2,388)
(1) Includes the effect of securities transactions and OTTI losses resulting in a provision (benefit) of
$1,138 million and $(1,740) million in 2012, $699 million and $(789) million in 2011 and $844
million and $(494) million in 2010, respectively.
The reconciliation of the federal statutory income tax rate to the
Company’s effective income tax rate applicable to income from continuing
operations (before noncontrolling interests and the cumulative effect of
accounting changes) for the years ended December 31 was as follows:
2012 2011 2010
Federal statutory rate 35.0% 35.0% 35.0%
State income taxes, net of federal benefit 3.0 1.5 (0.1)
Foreign income tax rate differential (4.8) (8.6) (10.0)
Audit settlements (1) (11.7) — (0.5)
Effect of tax law changes (2) (0.1) 2.0 (0.1)
Basis difference in affiliates (9.1) — —
Tax advantaged investments (12.2) (6.0) (6.7)
Other, net 0.2 0.2 (0.7)
Effective income tax rate 0.3% 24.1% 16.9%
(1) For 2012 and 2010, relates to the conclusion of the audit of various issues in the Company’s
2006–2008 and 2003–2005 U.S. federal tax audits, respectively. 2012 also includes an amount
related to the conclusion of a New York City tax audit for 2006–2008.
(2) For 2011, includes the results of the Japan tax rate change which resulted in a $300 million
DTA charge.
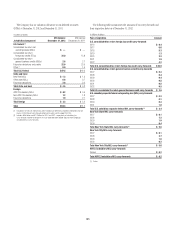
Deferred income taxes at December 31 related to the following:
In millions of dollars 2012 2011
Deferred tax assets
Credit loss deduction $10,947 $12,481
Deferred compensation and employee benefits 4,890 4,936
Restructuring and settlement reserves 1,645 1,331
Unremitted foreign earnings 5,114 7,362
Investment and loan basis differences 3,878 2,358
Cash flow hedges 1,361 1,673
Tax credit and net operating loss carry-forwards 28,087 22,764
Other deferred tax assets 2,651 2,127
Gross deferred tax assets $58,573 $55,032
Valuation allowance ——
Deferred tax assets after valuation allowance $58,573 $55,032
Deferred tax liabilities
Deferred policy acquisition costs
and value of insurance in force $ (495) $ (591)
Fixed assets and leases (623) (1,361)
Intangibles (1,517) (710)
Debt valuation adjustment on Citi liabilities (73) (533)
Other deferred tax liabilities (543) (307)
Gross deferred tax liabilities $ (3,251) $ (3,502)
Net deferred tax asset $55,322 $51,530
