Citibank 2012 Annual Report Download - page 193
Download and view the complete annual report
Please find page 193 of the 2012 Citibank annual report below. You can navigate through the pages in the report by either clicking on the pages listed below, or by using the keyword search tool below to find specific information within the annual report.-
 1
1 -
2
-
3
-
4
-
5
-
6
-
7
-
8
-
9
-
10
-
11
-
12
-
13
-
14
-
15
-
16
-
17
-
18
-
19
-
20
-
21
-
22
-
23
-
24
-
25
-
26
-
27
-
28
-
29
-
30
-
31
-
32
-
33
-
34
-
35
-
36
-
37
-
38
-
39
-
40
-
41
-
42
-
43
-
44
-
45
-
46
-
47
-
48
-
49
-
50
-
51
-
52
-
53
-
54
-
55
-
56
-
57
-
58
-
59
-
60
-
61
-
62
-
63
-
64
-
65
-
66
-
67
-
68
-
69
-
70
-
71
-
72
-
73
-
74
-
75
-
76
-
77
-
78
-
79
-
80
-
81
-
82
-
83
-
84
-
85
-
86
-
87
-
88
-
89
-
90
-
91
-
92
-
93
-
94
-
95
-
96
-
97
-
98
-
99
-
100
-
101
-
102
-
103
-
104
-
105
-
106
-
107
-
108
-
109
-
110
-
111
-
112
-
113
-
114
-
115
-
116
-
117
-
118
-
119
-
120
-
121
-
122
-
123
-
124
-
125
-
126
-
127
-
128
-
129
-
130
-
131
-
132
-
133
-
134
-
135
-
136
-
137
-
138
-
139
-
140
-
141
-
142
-
143
-
144
-
145
-
146
-
147
-
148
-
149
-
150
-
151
-
152
-
153
-
154
-
155
-
156
-
157
-
158
-
159
-
160
-
161
-
162
-
163
-
164
-
165
-
166
-
167
-
168
-
169
-
170
-
171
-
172
-
173
-
174
-
175
-
176
-
177
-
178
-
179
-
180
-
181
-
182
-
 183
183 -
 184
184 -
 185
185 -
 186
186 -
 187
187 -
 188
188 -
 189
189 -
 190
190 -
 191
191 -
 192
192 -
 193
193 -
 194
194 -
 195
195 -
 196
196 -
 197
197 -
 198
198 -
 199
199 -
 200
200 -
 201
201 -
 202
202 -
 203
203 -
204
-
205
-
206
-
207
-
208
-
209
-
210
-
211
-
212
-
213
-
214
-
215
-
216
-
217
-
218
-
219
-
220
-
221
-
222
-
223
-
224
-
225
-
226
-
227
-
228
-
229
-
230
-
231
-
232
-
233
-
234
-
235
-
236
-
237
-
238
-
239
-
240
-
241
-
242
-
243
-
244
-
245
-
246
-
247
-
248
-
249
-
250
-
251
-
252
-
253
-
254
-
255
-
256
-
257
-
258
-
259
-
260
-
261
-
262
-
263
-
264
-
265
-
266
-
267
-
268
-
269
-
270
-
271
-
272
-
273
-
274
-
275
-
276
-
277
-
278
-
279
-
280
-
281
-
282
-
283
-
284
-
285
-
286
-
287
-
288
-
289
-
290
-
291
-
292
-
293
-
294
-
295
-
296
-
297
-
298
-
299
-
300
-
301
-
302
-
303
-
304
-
305
-
306
-
307
-
308
-
309
-
310
-
311
-
312
-
313
-
314
-
315
-
316
-
317
-
318
-
319
-
320
-
321
-
322
-
323
-
324
 |
 |

171
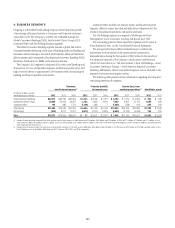
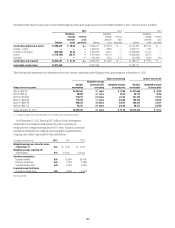
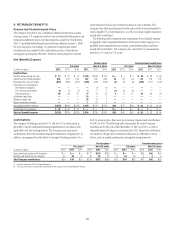
9. RETIREMENT BENEFITS
Pension and Postretirement Plans
The Company has several non-contributory defined benefit pension plans
covering certain U.S. employees and has various defined benefit pension and
termination indemnity plans covering employees outside the United States.
The U.S. qualified defined benefit plan was frozen effective January 1, 2008
for most employees. Accordingly, no additional compensation-based
contributions were credited to the cash balance portion of the plan for
existing plan participants after 2007. However, certain employees covered
under the prior final pay plan formula continue to accrue benefits. The
Company also offers postretirement health care and life insurance benefits to
certain eligible U.S. retired employees, as well as to certain eligible employees
outside the United States.
The following table summarizes the components of net (benefit) expense
recognized in the Consolidated Statement of Income for the Company’s U.S.
qualified and nonqualified pension plans, postretirement plans and plans
outside the United States. The Company uses a December 31 measurement
date for its U.S. and non-U.S. plans.
Net (Benefit) Expense
Pension plans Postretirement benefit plans
U.S. plans Non-U.S. plans U.S. plans Non-U.S. plans
In millions of dollars 2012 2011 2010 2012 2011 2010 2012 2011 2010 2012 2011 2010
Qualified Plans
Benefits earned during the year $ 12 $ 13 $ 14 $ 199 $ 203 $ 167 $— $— $ 1 $ 29 $ 28 $ 23
Interest cost on benefit obligation 565 612 644 367 382 342 44 53 59 116 118 105
Expected return on plan assets (897) (890) (874) (399) (422) (378) (4) (6) (8) (108) (117) (100)
Amortization of unrecognized
Net transition obligation —— — —(1) (1) —— — —— —
Prior service cost (benefit) (1) (1) (1) 44 4 (1) (3) (3) —— —
Net actuarial loss 96 64 47 77 72 57 43 11 25 24 20
Curtailment (gain) loss —— — 10 4 1 —— — —— —
Settlement (gain) loss —— — 35 10 7 —— — —— —
Special termination benefits —— — 127 5 —— — —— —
Net qualified (benefit) expense $(225) $(202) $(170) $ 294 $ 279 $ 204 $43 $47 $60 $ 62 $ 53 $ 48
Nonqualified plans expense $ 42 $ 42 $ 41 $ — $ — $ — $— $— $— $ — $ — $ —
Total net (benefit) expense $(183) $(160) $(129) $ 294 $ 279 $ 204 $43 $47 $60 $ 62 $ 53 $ 48
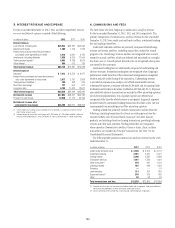
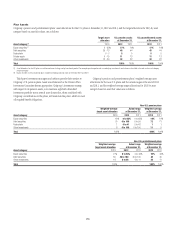
Contributions
The Company’s funding practice for U.S. and non-U.S. pension plans is
generally to fund to minimum funding requirements in accordance with
applicable local laws and regulations. The Company may increase its
contributions above the minimum required contribution, if appropriate. In
addition, management has the ability to change its funding practices. For
the U.S. pension plans, there were no minimum required cash contributions
for 2012 or 2011. The following table summarizes the actual Company
contributions for the years ended December 31, 2012 and 2011, as well as
estimated expected Company contributions for 2013. Expected contributions
are subject to change since contribution decisions are affected by various
factors, such as market performance and regulatory requirements.
Pension plans (1) Postretirement plans (1)
U.S. plans (2) Non-U.S. plans U.S. plans Non-U.S. plans
In millions of dollars 2013 2012 2011 2013 2012 2011 2013 2012 2011 2013 2012 2011
Cash contributions paid by the Company $— $— $— $ 177 $270 $342 $— $— $— $82 $88 $70
Benefits paid directly by the Company 54 54 51 47 82 47 57 54 53 5 45
Total Company contributions $54 $54 $51 $ 224 $352 $389 $57 $54 $53 $87 $92 $75
(1) Payments reported for 2013 are expected amounts.
(2) The U.S. pension plans include benefits paid directly by the Company for the nonqualified pension plan.