Citibank 2012 Annual Report Download - page 114
Download and view the complete annual report
Please find page 114 of the 2012 Citibank annual report below. You can navigate through the pages in the report by either clicking on the pages listed below, or by using the keyword search tool below to find specific information within the annual report.-
 1
1 -
2
-
3
-
4
-
5
-
6
-
7
-
8
-
9
-
10
-
11
-
12
-
13
-
14
-
15
-
16
-
17
-
18
-
19
-
20
-
21
-
22
-
23
-
24
-
25
-
26
-
27
-
28
-
29
-
30
-
31
-
32
-
33
-
34
-
35
-
36
-
37
-
38
-
39
-
40
-
41
-
42
-
43
-
44
-
45
-
46
-
47
-
48
-
49
-
50
-
51
-
52
-
53
-
54
-
55
-
56
-
57
-
58
-
59
-
60
-
61
-
62
-
63
-
64
-
65
-
66
-
67
-
68
-
69
-
70
-
71
-
72
-
73
-
74
-
75
-
76
-
77
-
78
-
79
-
80
-
81
-
82
-
83
-
84
-
85
-
86
-
87
-
88
-
89
-
90
-
91
-
92
-
93
-
94
-
95
-
96
-
97
-
98
-
99
-
100
-
101
-
102
-
103
-
 104
104 -
 105
105 -
 106
106 -
 107
107 -
 108
108 -
 109
109 -
 110
110 -
 111
111 -
 112
112 -
 113
113 -
 114
114 -
 115
115 -
 116
116 -
 117
117 -
 118
118 -
 119
119 -
 120
120 -
 121
121 -
 122
122 -
 123
123 -
 124
124 -
125
-
126
-
127
-
128
-
129
-
130
-
131
-
132
-
133
-
134
-
135
-
136
-
137
-
138
-
139
-
140
-
141
-
142
-
143
-
144
-
145
-
146
-
147
-
148
-
149
-
150
-
151
-
152
-
153
-
154
-
155
-
156
-
157
-
158
-
159
-
160
-
161
-
162
-
163
-
164
-
165
-
166
-
167
-
168
-
169
-
170
-
171
-
172
-
173
-
174
-
175
-
176
-
177
-
178
-
179
-
180
-
181
-
182
-
183
-
184
-
185
-
186
-
187
-
188
-
189
-
190
-
191
-
192
-
193
-
194
-
195
-
196
-
197
-
198
-
199
-
200
-
201
-
202
-
203
-
204
-
205
-
206
-
207
-
208
-
209
-
210
-
211
-
212
-
213
-
214
-
215
-
216
-
217
-
218
-
219
-
220
-
221
-
222
-
223
-
224
-
225
-
226
-
227
-
228
-
229
-
230
-
231
-
232
-
233
-
234
-
235
-
236
-
237
-
238
-
239
-
240
-
241
-
242
-
243
-
244
-
245
-
246
-
247
-
248
-
249
-
250
-
251
-
252
-
253
-
254
-
255
-
256
-
257
-
258
-
259
-
260
-
261
-
262
-
263
-
264
-
265
-
266
-
267
-
268
-
269
-
270
-
271
-
272
-
273
-
274
-
275
-
276
-
277
-
278
-
279
-
280
-
281
-
282
-
283
-
284
-
285
-
286
-
287
-
288
-
289
-
290
-
291
-
292
-
293
-
294
-
295
-
296
-
297
-
298
-
299
-
300
-
301
-
302
-
303
-
304
-
305
-
306
-
307
-
308
-
309
-
310
-
311
-
312
-
313
-
314
-
315
-
316
-
317
-
318
-
319
-
320
-
321
-
322
-
323
-
324
 |
 |
92
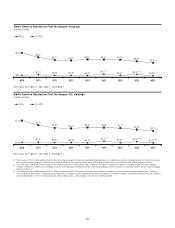
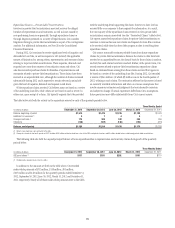
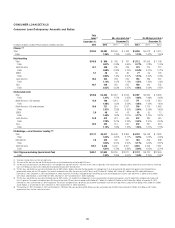
Citi’s residential first mortgages with an LTV above 100% has declined by
39% since year end 2011, and high LTV loans with FICO scores of less than
660 decreased by 37% to $7.1 billion. The residential first mortgage portfolio
has migrated to a higher FICO and lower LTV distribution as a result of asset
sales, home price appreciation and principal forgiveness. Loans 90+ days
past due have declined by approximately 32%, or $0.6 billion, year-over-year
to approximately $1.2 billion. The decline in 90+ days past due residential
mortgages with refreshed FICO scores of less than 660 as well as higher LTVs
primarily can be attributed to asset sales and modification programs, offset
by the lengthening of the foreclosure process, as discussed in the sections
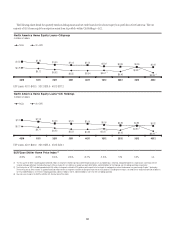
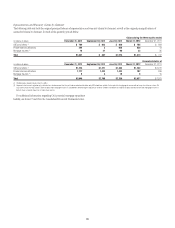
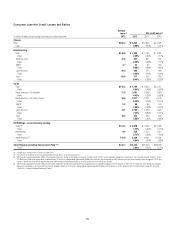
above. Citi’s home equity loans with a CLTV above 100% have declined by
28% since year end 2011, and high CLTV loans with FICO scores of less than
660 decreased by 31% to approximately $3.7 billion. The CLTV improvement
was primarily the result of home price appreciation.
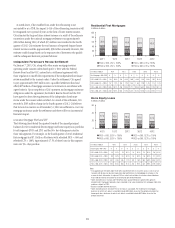
Residential first mortgages historically have experienced higher
delinquency rates, as compared to home equity loans, despite the fact that
home equity loans are typically in junior lien positions and residential first
mortgages are typically in a first lien position. Citi believes this difference is
primarily because residential first mortgages are written down to collateral
value less cost to sell at 180 days past due and remain in the delinquency
population until full disposition through sale, repayment or foreclosure;
however, home equity loans are generally fully charged off at 180 days
past due and thus removed from the delinquency calculation. In addition,
due to the longer timelines to foreclose on a residential first mortgage
(see “Foreclosures” above), these loans tend to remain in the delinquency
statistics for a longer period and, consequently, the 90 days or more
delinquencies of these loans remain higher.
Mortgage Servicing Rights
To minimize credit and liquidity risk, Citi sells most of the conforming
mortgage loans it originates but retains the servicing rights. These sale
transactions create an intangible asset referred to as mortgage servicing
rights (MSRs), which are recorded at fair value on Citi’s Consolidated
Balance Sheet. The fair value of MSRs is primarily affected by changes in
prepayments of mortgages that result from shifts in mortgage interest rates.
Specifically, the fair value of MSRs declines with increased prepayments,
and declines in or continued low interest rates tend to lead to increased
prepayments. In managing this risk, Citi economically hedges a significant
portion of the value of its MSRs through the use of interest rate derivative
contracts, forward purchase and sale commitments of mortgage-backed
securities and purchased securities classified as trading account assets.
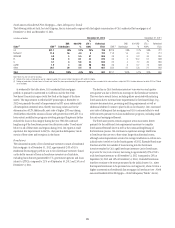
Citi’s MSRs totaled $1.9 billion as of December 31, 2012, compared
to $1.9 billion and $2.6 billion at September 30, 2012 and December 31,
2011, respectively. The decrease in the value of Citi’s MSRs from year-end
2011 primarily reflected the impact from lower interest rates in addition to
amortization as well as an increase in servicing costs related to the servicing
of the loans remaining in Citi Holdings. As the mix of loans remaining in
Citi Holdings has gradually shifted to more delinquent, non-performing
loans, the cost for servicing those loans has increased. As of December 31,
2012, approximately $1.3 billion of MSRs were specific to Citicorp, with the
remainder to Citi Holdings.
For additional information on Citi’s MSRs, see Note 22 to the Consolidated
Financial Statements.
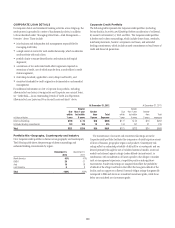
Citigroup Residential Mortgages—Representations and
Warranties
Overview
In connection with Citi’s sales of residential mortgage loans to the U.S.
government-sponsored entities (GSEs) and, in most cases, other mortgage
loan sales and private-label securitizations, Citi makes representations
and warranties that the loans sold meet certain requirements. The specific
representations and warranties made by Citi in any particular transaction
depend on, among other things, the nature of the transaction and the
requirements of the investor (e.g., whole loan sale to the GSEs versus loans
sold through securitization transactions), as well as the credit quality of the
loan (e.g., prime, Alt-A or subprime).
These sales expose Citi to potential claims for breaches of its
representations and warranties. In the event of a breach of its representations
and warranties, Citi could be required either to repurchase the mortgage
loans with the identified defects (generally at unpaid principal balance plus
accrued interest) or to indemnify (“make whole”) the investors for their
losses on these loans. To the extent Citi made representation and warranties
on loans it purchased from third-party sellers that remain financially viable,
Citi may have the right to seek recovery of repurchase losses or make whole
payments from the third party based on representations and warranties made
by the third party to Citi (a “back-to-back” claim).