Citibank 2012 Annual Report Download - page 64
Download and view the complete annual report
Please find page 64 of the 2012 Citibank annual report below. You can navigate through the pages in the report by either clicking on the pages listed below, or by using the keyword search tool below to find specific information within the annual report.-
 1
1 -
2
-
3
-
4
-
5
-
6
-
7
-
8
-
9
-
10
-
11
-
12
-
13
-
14
-
15
-
16
-
17
-
18
-
19
-
20
-
21
-
22
-
23
-
24
-
25
-
26
-
27
-
28
-
29
-
30
-
31
-
32
-
33
-
34
-
35
-
36
-
37
-
38
-
39
-
40
-
41
-
42
-
43
-
44
-
45
-
46
-
47
-
48
-
49
-
50
-
51
-
52
-
53
-
 54
54 -
 55
55 -
 56
56 -
 57
57 -
 58
58 -
 59
59 -
 60
60 -
 61
61 -
 62
62 -
 63
63 -
 64
64 -
 65
65 -
 66
66 -
 67
67 -
 68
68 -
 69
69 -
 70
70 -
 71
71 -
 72
72 -
 73
73 -
 74
74 -
75
-
76
-
77
-
78
-
79
-
80
-
81
-
82
-
83
-
84
-
85
-
86
-
87
-
88
-
89
-
90
-
91
-
92
-
93
-
94
-
95
-
96
-
97
-
98
-
99
-
100
-
101
-
102
-
103
-
104
-
105
-
106
-
107
-
108
-
109
-
110
-
111
-
112
-
113
-
114
-
115
-
116
-
117
-
118
-
119
-
120
-
121
-
122
-
123
-
124
-
125
-
126
-
127
-
128
-
129
-
130
-
131
-
132
-
133
-
134
-
135
-
136
-
137
-
138
-
139
-
140
-
141
-
142
-
143
-
144
-
145
-
146
-
147
-
148
-
149
-
150
-
151
-
152
-
153
-
154
-
155
-
156
-
157
-
158
-
159
-
160
-
161
-
162
-
163
-
164
-
165
-
166
-
167
-
168
-
169
-
170
-
171
-
172
-
173
-
174
-
175
-
176
-
177
-
178
-
179
-
180
-
181
-
182
-
183
-
184
-
185
-
186
-
187
-
188
-
189
-
190
-
191
-
192
-
193
-
194
-
195
-
196
-
197
-
198
-
199
-
200
-
201
-
202
-
203
-
204
-
205
-
206
-
207
-
208
-
209
-
210
-
211
-
212
-
213
-
214
-
215
-
216
-
217
-
218
-
219
-
220
-
221
-
222
-
223
-
224
-
225
-
226
-
227
-
228
-
229
-
230
-
231
-
232
-
233
-
234
-
235
-
236
-
237
-
238
-
239
-
240
-
241
-
242
-
243
-
244
-
245
-
246
-
247
-
248
-
249
-
250
-
251
-
252
-
253
-
254
-
255
-
256
-
257
-
258
-
259
-
260
-
261
-
262
-
263
-
264
-
265
-
266
-
267
-
268
-
269
-
270
-
271
-
272
-
273
-
274
-
275
-
276
-
277
-
278
-
279
-
280
-
281
-
282
-
283
-
284
-
285
-
286
-
287
-
288
-
289
-
290
-
291
-
292
-
293
-
294
-
295
-
296
-
297
-
298
-
299
-
300
-
301
-
302
-
303
-
304
-
305
-
306
-
307
-
308
-
309
-
310
-
311
-
312
-
313
-
314
-
315
-
316
-
317
-
318
-
319
-
320
-
321
-
322
-
323
-
324
 |
 |

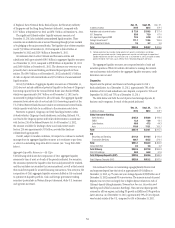
42
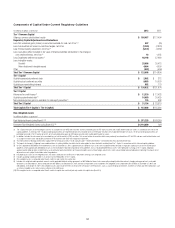
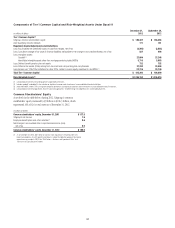
Components of Capital Under Current Regulatory Guidelines
In millions of dollars at year end 2012 2011
Tier 1 Common Capital
Citigroup common stockholders’ equity $ 186,487 $177,494
Regulatory Capital Adjustments and Deductions:
Less: Net unrealized gains (losses) on securities available-for-sale, net of tax (1)(2) 597 (35)
Less: Accumulated net losses on cash flow hedges, net of tax (2,293) (2,820)
Less: Pension liability adjustment, net of tax (3) (5,270) (4,282)
Less: Cumulative effect included in fair value of financial liabilities attributable to the change in
own creditworthiness, net of tax (4) 18 1,265
Less: Disallowed deferred tax assets (5) 40,148 37,980
Less: Intangible assets:
Goodwill 25,686 25,413
Other disallowed intangible assets 4,004 4,550
Other (502) (569)
Total Tier 1 Common Capital $ 123,095 $114,854
Tier 1 Capital
Qualifying perpetual preferred stock $ 2,562 $ 312
Qualifying trust preferred securities 9,983 15,929
Qualifying noncontrolling interests 892 779
Total Tier 1 Capital $ 136,532 $131,874
Tier 2 Capital
Allowance for credit losses (6) $ 12,330 $ 12,423
Qualifying subordinated debt (7) 18,689 20,429
Net unrealized pretax gains on available-for-sale equity securities (1) 135 658
Total Tier 2 Capital $ 31,154 $ 33,510
Total Capital (Tier 1 Capital + Tier 2 Capital) $ 167,686 $165,384
Risk-Weighted Assets
In millions of dollars at year end
Risk-Weighted Assets (using Basel I) (8)(9) $ 971,253 $973,369
Estimated Risk-Weighted Assets (using Basel II.5) (10) $1,110,859 N/A
(1) Tier 1 Capital excludes net unrealized gains (losses) on available-for-sale (AFS) debt securities and net unrealized gains on AFS equity securities with readily determinable fair values, in accordance with risk-based
capital guidelines. In arriving at Tier 1 Capital, banking organizations are required to deduct net unrealized losses on AFS equity securities with readily determinable fair values, net of tax. Banking organizations are
permitted to include in Tier 2 Capital up to 45% of net unrealized pretax gains on AFS equity securities with readily determinable fair values.
(2) In addition, includes the net amount of unamortized loss on held-to-maturity (HTM) securities. This amount relates to securities which were previously transferred from AFS to HTM, and non-credit-related factors such
as changes in interest rates and liquidity spreads for HTM securities with other-than-temporary impairment.
(3) The Federal Reserve Board granted interim capital relief for the impact of ASC 715-20, Compensation—Retirement Benefits—Defined Benefits Plans (formerly SFAS 158).
(4) The impact of changes in Citigroup’s own creditworthiness in valuing liabilities for which the fair value option has been elected is excluded from Tier 1 Capital, in accordance with risk-based capital guidelines.
(5) Of Citi’s approximate $55 billion of net deferred tax assets at December 31, 2012, approximately $11 billion of such assets were includable without limitation in regulatory capital pursuant to risk-based capital
guidelines, while approximately $40 billion of such assets exceeded the limitation imposed by these guidelines and, as “disallowed deferred tax assets,” were deducted in arriving at Tier 1 Capital. Citigroup’s
approximate $4 billion of other net deferred tax assets primarily represented effects of the pension liability and cash flow hedges adjustments, which are permitted to be excluded prior to deriving the amount of net
deferred tax assets subject to limitation under the guidelines.
(6) Includable up to 1.25% of risk-weighted assets. Any excess allowance for credit losses is deducted in arriving at risk-weighted assets.
(7) Includes qualifying subordinated debt in an amount not exceeding 50% of Tier 1 Capital.
(8) Risk-weighted assets as computed under Basel I credit risk and market risk capital rules.
(9) Includes risk-weighted credit equivalent amounts, net of applicable bilateral netting agreements, of $62 billion for interest rate, commodity and equity derivative contracts, foreign exchange contracts, and credit
derivatives as of December 31, 2012, compared with $67 billion as of December 31, 2011. Market risk equivalent assets included in risk-weighted assets amounted to $41.5 billion at December 31, 2012 and
$46.8 billion at December 31, 2011. Risk-weighted assets also include the effect of certain other off-balance-sheet exposures, such as unused lending commitments and letters of credit, and reflect deductions such
as certain intangible assets and any excess allowance for credit losses.
(10) Risk-weighted assets as computed under Basel I credit risk capital rules and final (revised) market risk capital rules (Basel II.5).