Citibank 2012 Annual Report Download - page 232
Download and view the complete annual report
Please find page 232 of the 2012 Citibank annual report below. You can navigate through the pages in the report by either clicking on the pages listed below, or by using the keyword search tool below to find specific information within the annual report.-
 1
1 -
2
-
3
-
4
-
5
-
6
-
7
-
8
-
9
-
10
-
11
-
12
-
13
-
14
-
15
-
16
-
17
-
18
-
19
-
20
-
21
-
22
-
23
-
24
-
25
-
26
-
27
-
28
-
29
-
30
-
31
-
32
-
33
-
34
-
35
-
36
-
37
-
38
-
39
-
40
-
41
-
42
-
43
-
44
-
45
-
46
-
47
-
48
-
49
-
50
-
51
-
52
-
53
-
54
-
55
-
56
-
57
-
58
-
59
-
60
-
61
-
62
-
63
-
64
-
65
-
66
-
67
-
68
-
69
-
70
-
71
-
72
-
73
-
74
-
75
-
76
-
77
-
78
-
79
-
80
-
81
-
82
-
83
-
84
-
85
-
86
-
87
-
88
-
89
-
90
-
91
-
92
-
93
-
94
-
95
-
96
-
97
-
98
-
99
-
100
-
101
-
102
-
103
-
104
-
105
-
106
-
107
-
108
-
109
-
110
-
111
-
112
-
113
-
114
-
115
-
116
-
117
-
118
-
119
-
120
-
121
-
122
-
123
-
124
-
125
-
126
-
127
-
128
-
129
-
130
-
131
-
132
-
133
-
134
-
135
-
136
-
137
-
138
-
139
-
140
-
141
-
142
-
143
-
144
-
145
-
146
-
147
-
148
-
149
-
150
-
151
-
152
-
153
-
154
-
155
-
156
-
157
-
158
-
159
-
160
-
161
-
162
-
163
-
164
-
165
-
166
-
167
-
168
-
169
-
170
-
171
-
172
-
173
-
174
-
175
-
176
-
177
-
178
-
179
-
180
-
181
-
182
-
183
-
184
-
185
-
186
-
187
-
188
-
189
-
190
-
191
-
192
-
193
-
194
-
195
-
196
-
197
-
198
-
199
-
200
-
201
-
202
-
203
-
204
-
205
-
206
-
207
-
208
-
209
-
210
-
211
-
212
-
213
-
214
-
215
-
216
-
217
-
218
-
219
-
220
-
221
-
 222
222 -
 223
223 -
 224
224 -
 225
225 -
 226
226 -
 227
227 -
 228
228 -
 229
229 -
 230
230 -
 231
231 -
 232
232 -
 233
233 -
 234
234 -
 235
235 -
 236
236 -
 237
237 -
 238
238 -
 239
239 -
 240
240 -
 241
241 -
 242
242 -
243
-
244
-
245
-
246
-
247
-
248
-
249
-
250
-
251
-
252
-
253
-
254
-
255
-
256
-
257
-
258
-
259
-
260
-
261
-
262
-
263
-
264
-
265
-
266
-
267
-
268
-
269
-
270
-
271
-
272
-
273
-
274
-
275
-
276
-
277
-
278
-
279
-
280
-
281
-
282
-
283
-
284
-
285
-
286
-
287
-
288
-
289
-
290
-
291
-
292
-
293
-
294
-
295
-
296
-
297
-
298
-
299
-
300
-
301
-
302
-
303
-
304
-
305
-
306
-
307
-
308
-
309
-
310
-
311
-
312
-
313
-
314
-
315
-
316
-
317
-
318
-
319
-
320
-
321
-
322
-
323
-
324
 |
 |

210
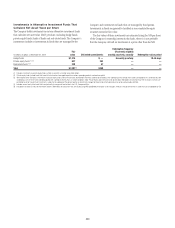
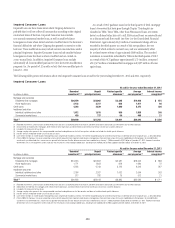
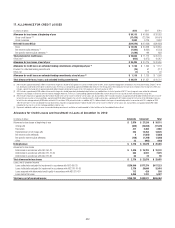
Corporate Troubled Debt Restructurings
The following tables provide details on Corporate TDR activity and default information as of and for the years ended December 31, 2012 and 2011.
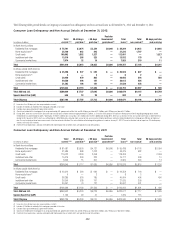
The following table presents Corporate TDRs occurring during the year ended December 31, 2012.
In millions of dollars
Carrying
Value
TDRs
involving changes
in the amount
and/or timing of
principal payments (1)
TDRs
involving changes
in the amount
and/or timing of
interest payments (2)
TDRs
involving changes
in the amount
and/or timing of
both principal and
interest payments
Balance of
principal forgiven
or deferred
Net
P&L
impact (3)
Commercial and industrial $ 99 $ 84 $ 4 $11 $— $ 1
Financial institutions — — — — — —
Mortgage and real estate 113 60 — 53 — —
Other — — — — — —
Total $212 $144 $ 4 $64 $— $ 1
(1) TDRs involving changes in the amount or timing of principal payments may involve principal forgiveness or deferral of periodic and/or final principal payments.
(2) TDRs involving changes in the amount or timing of interest payments may involve a below-market interest rate.
(3) Balances reflect charge-offs and reserves recorded during the years ended December 31, 2012 on loans subject to a TDR during the year then ended.
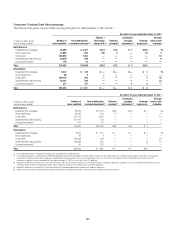
The following table presents Corporate TDRs occurring during the year ended December 31, 2011.
In millions of dollars
Carrying
Value
TDRs
involving changes
in the amount
and/or timing of
principal payments (1)
TDRs
involving changes
in the amount
and/or timing of
interest payments (2)
TDRs
involving changes
in the amount
and/or timing of
both principal and
interest payments
Balance of
principal forgiven
or deferred
Net
P&L
impact (3)
Commercial and industrial $126 $— $ 16 $110 $— $16
Financial institutions — — — — — —
Mortgage and real estate 250 3 20 227 4 37
Other 74 — 67 7 — —
Total $450 $ 3 $ 103 $344 $ 4 $53
(1) TDRs involving changes in the amount or timing of principal payments may involve principal forgiveness or deferral of periodic and/or final principal payments.
(2) TDRs involving changes in the amount or timing of interest payments may involve a below-market interest rate.
(3) Balances reflect charge-offs and reserves recorded during the year ended December 31, 2011 on loans subject to a TDR during the period then ended.
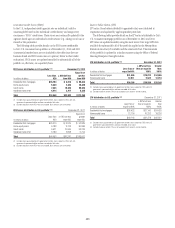
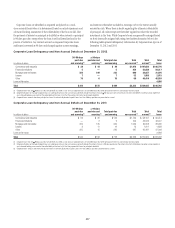
The following table presents total Corporate loans modified in a TDR at December 31, 2012 and 2011, as well as those TDRs that defaulted during 2012 and
2011, and for which the payment default occurred within one year of the modification:
In millions of dollars
TDR Balances at
December 31, 2012
TDRs
in payment default
during the year Ended
December 31, 2012
TDR Balances at
December 31, 2011
TDRs
in payment default
during the year Ended
December 31, 2011
Commercial and industrial $275 $94 $ 429 $ 7
Financial institutions 17 — 564 —
Mortgage and real estate 131 — 258 —
Other 450 — 85 —
Total $873 $94 $1,336 $ 7
(1) Payment default constitutes failure to pay principal or interest when due per the contractual terms of the loan.