Citibank 2012 Annual Report Download - page 200
Download and view the complete annual report
Please find page 200 of the 2012 Citibank annual report below. You can navigate through the pages in the report by either clicking on the pages listed below, or by using the keyword search tool below to find specific information within the annual report.-
 1
1 -
2
-
3
-
4
-
5
-
6
-
7
-
8
-
9
-
10
-
11
-
12
-
13
-
14
-
15
-
16
-
17
-
18
-
19
-
20
-
21
-
22
-
23
-
24
-
25
-
26
-
27
-
28
-
29
-
30
-
31
-
32
-
33
-
34
-
35
-
36
-
37
-
38
-
39
-
40
-
41
-
42
-
43
-
44
-
45
-
46
-
47
-
48
-
49
-
50
-
51
-
52
-
53
-
54
-
55
-
56
-
57
-
58
-
59
-
60
-
61
-
62
-
63
-
64
-
65
-
66
-
67
-
68
-
69
-
70
-
71
-
72
-
73
-
74
-
75
-
76
-
77
-
78
-
79
-
80
-
81
-
82
-
83
-
84
-
85
-
86
-
87
-
88
-
89
-
90
-
91
-
92
-
93
-
94
-
95
-
96
-
97
-
98
-
99
-
100
-
101
-
102
-
103
-
104
-
105
-
106
-
107
-
108
-
109
-
110
-
111
-
112
-
113
-
114
-
115
-
116
-
117
-
118
-
119
-
120
-
121
-
122
-
123
-
124
-
125
-
126
-
127
-
128
-
129
-
130
-
131
-
132
-
133
-
134
-
135
-
136
-
137
-
138
-
139
-
140
-
141
-
142
-
143
-
144
-
145
-
146
-
147
-
148
-
149
-
150
-
151
-
152
-
153
-
154
-
155
-
156
-
157
-
158
-
159
-
160
-
161
-
162
-
163
-
164
-
165
-
166
-
167
-
168
-
169
-
170
-
171
-
172
-
173
-
174
-
175
-
176
-
177
-
178
-
179
-
180
-
181
-
182
-
183
-
184
-
185
-
186
-
187
-
188
-
189
-
 190
190 -
 191
191 -
 192
192 -
 193
193 -
 194
194 -
 195
195 -
 196
196 -
 197
197 -
 198
198 -
 199
199 -
 200
200 -
 201
201 -
 202
202 -
 203
203 -
 204
204 -
 205
205 -
 206
206 -
 207
207 -
 208
208 -
 209
209 -
 210
210 -
211
-
212
-
213
-
214
-
215
-
216
-
217
-
218
-
219
-
220
-
221
-
222
-
223
-
224
-
225
-
226
-
227
-
228
-
229
-
230
-
231
-
232
-
233
-
234
-
235
-
236
-
237
-
238
-
239
-
240
-
241
-
242
-
243
-
244
-
245
-
246
-
247
-
248
-
249
-
250
-
251
-
252
-
253
-
254
-
255
-
256
-
257
-
258
-
259
-
260
-
261
-
262
-
263
-
264
-
265
-
266
-
267
-
268
-
269
-
270
-
271
-
272
-
273
-
274
-
275
-
276
-
277
-
278
-
279
-
280
-
281
-
282
-
283
-
284
-
285
-
286
-
287
-
288
-
289
-
290
-
291
-
292
-
293
-
294
-
295
-
296
-
297
-
298
-
299
-
300
-
301
-
302
-
303
-
304
-
305
-
306
-
307
-
308
-
309
-
310
-
311
-
312
-
313
-
314
-
315
-
316
-
317
-
318
-
319
-
320
-
321
-
322
-
323
-
324
 |
 |

178
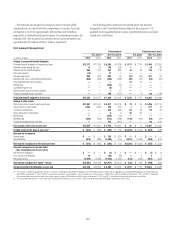
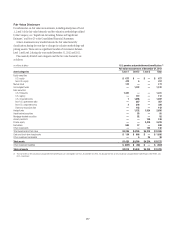
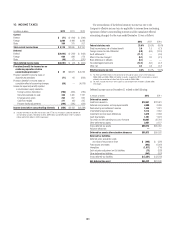
In millions of dollars U.S. pension and postretirement benefit plans (1)
Fair value measurement at December 31, 2011
Asset categories Level 1 Level 2 Level 3 Total
Equity securities
U.S. equity $ 572 $ 5 $ 51 $ 628
Non-U.S. equity 229 — 19 248
Mutual funds 137 — — 137
Commingled funds 440 594 — 1,034
Debt securities
U.S. Treasuries 1,760 — — 1,760
U.S. agency — 120 — 120
U.S. corporate bonds 2 1,073 5 1,080
Non-U.S. government debt — 352 — 352
Non-U.S. corporate bonds 4 271 — 275
State and municipal debt — 122 — 122
Hedge funds — 1,087 870 1,957
Asset-backed securities — 19 — 19
Mortgage-backed securities — 32 — 32
Annuity contracts — — 155 155
Private equity — — 2,474 2,474
Derivatives 691 36 — 727
Other investments 92 20 121 233
Total investments at fair value $3,927 $3,731 $3,695 $11,353
Cash and short-term investments $ 412 $ 402 $ — $ 814
Other investment receivables — 393 221 614
Total assets $4,339 $4,526 $3,916 $12,781
Other investment liabilities $ (683) $ (33) $ — $ (716)
Total net assets $3,656 $4,493 $3,916 $12,065
(1) The investments of the U.S. pension and postretirement benefit plans are commingled in one trust. At December 31, 2011, the allocable interests of the U.S. pension and postretirement benefit plans were 99.2% and
0.8%, respectively.