Citibank 2012 Annual Report Download - page 291
Download and view the complete annual report
Please find page 291 of the 2012 Citibank annual report below. You can navigate through the pages in the report by either clicking on the pages listed below, or by using the keyword search tool below to find specific information within the annual report.-
 1
1 -
2
-
3
-
4
-
5
-
6
-
7
-
8
-
9
-
10
-
11
-
12
-
13
-
14
-
15
-
16
-
17
-
18
-
19
-
20
-
21
-
22
-
23
-
24
-
25
-
26
-
27
-
28
-
29
-
30
-
31
-
32
-
33
-
34
-
35
-
36
-
37
-
38
-
39
-
40
-
41
-
42
-
43
-
44
-
45
-
46
-
47
-
48
-
49
-
50
-
51
-
52
-
53
-
54
-
55
-
56
-
57
-
58
-
59
-
60
-
61
-
62
-
63
-
64
-
65
-
66
-
67
-
68
-
69
-
70
-
71
-
72
-
73
-
74
-
75
-
76
-
77
-
78
-
79
-
80
-
81
-
82
-
83
-
84
-
85
-
86
-
87
-
88
-
89
-
90
-
91
-
92
-
93
-
94
-
95
-
96
-
97
-
98
-
99
-
100
-
101
-
102
-
103
-
104
-
105
-
106
-
107
-
108
-
109
-
110
-
111
-
112
-
113
-
114
-
115
-
116
-
117
-
118
-
119
-
120
-
121
-
122
-
123
-
124
-
125
-
126
-
127
-
128
-
129
-
130
-
131
-
132
-
133
-
134
-
135
-
136
-
137
-
138
-
139
-
140
-
141
-
142
-
143
-
144
-
145
-
146
-
147
-
148
-
149
-
150
-
151
-
152
-
153
-
154
-
155
-
156
-
157
-
158
-
159
-
160
-
161
-
162
-
163
-
164
-
165
-
166
-
167
-
168
-
169
-
170
-
171
-
172
-
173
-
174
-
175
-
176
-
177
-
178
-
179
-
180
-
181
-
182
-
183
-
184
-
185
-
186
-
187
-
188
-
189
-
190
-
191
-
192
-
193
-
194
-
195
-
196
-
197
-
198
-
199
-
200
-
201
-
202
-
203
-
204
-
205
-
206
-
207
-
208
-
209
-
210
-
211
-
212
-
213
-
214
-
215
-
216
-
217
-
218
-
219
-
220
-
221
-
222
-
223
-
224
-
225
-
226
-
227
-
228
-
229
-
230
-
231
-
232
-
233
-
234
-
235
-
236
-
237
-
238
-
239
-
240
-
241
-
242
-
243
-
244
-
245
-
246
-
247
-
248
-
249
-
250
-
251
-
252
-
253
-
254
-
255
-
256
-
257
-
258
-
259
-
260
-
261
-
262
-
263
-
264
-
265
-
266
-
267
-
268
-
269
-
270
-
271
-
272
-
273
-
274
-
275
-
276
-
277
-
278
-
279
-
280
-
 281
281 -
 282
282 -
 283
283 -
 284
284 -
 285
285 -
 286
286 -
 287
287 -
 288
288 -
 289
289 -
 290
290 -
 291
291 -
 292
292 -
 293
293 -
 294
294 -
 295
295 -
 296
296 -
 297
297 -
 298
298 -
 299
299 -
 300
300 -
 301
301 -
302
-
303
-
304
-
305
-
306
-
307
-
308
-
309
-
310
-
311
-
312
-
313
-
314
-
315
-
316
-
317
-
318
-
319
-
320
-
321
-
322
-
323
-
324
 |
 |

269
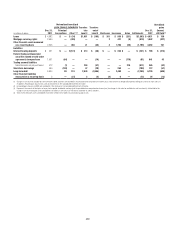
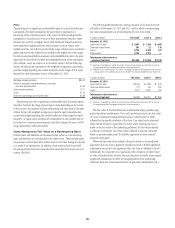
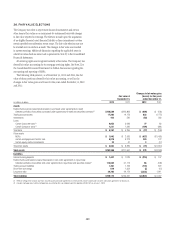
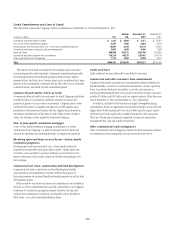
26. FAIR VALUE ELECTIONS
The Company may elect to report most financial instruments and certain
other items at fair value on an instrument-by-instrument basis with changes
in fair value reported in earnings. The election is made upon the acquisition
of an eligible financial asset, financial liability or firm commitment or when
certain specified reconsideration events occur. The fair value election may not
be revoked once an election is made. The changes in fair value are recorded
in current earnings. Additional discussion regarding the applicable areas in
which fair value elections were made is presented in Note 25 to the Consolidated
Financial Statements.
All servicing rights are recognized initially at fair value. The Company has
elected fair value accounting for its mortgage servicing rights. See Note 22 to
the Consolidated Financial Statements for further discussions regarding the
accounting and reporting of MSRs.
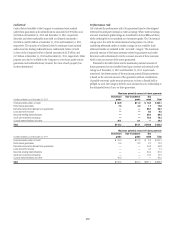
The following table presents, as of December 31, 2012 and 2011, the fair
value of those positions selected for fair value accounting, as well as the
changes in fair value gains and losses for the years ended December 31, 2012
and 2011:
Fair value at
December 31,
Changes in fair value gains
(losses) for the years
ended December 31,
In millions of dollars 2012 2011 2012 2011
Assets
Federal funds sold and securities borrowed or purchased under agreements to resell
Selected portfolios of securities purchased under agreements to resell and securities borrowed (1) $160,589 $142,862 $ (409) $ (138)
Trading account assets 17,206 14,179 838 (1,775)
Investments 443 526 (50) 233
Loans
Certain Corporate loans (2) 4,056 3,939 77 82
Certain Consumer loans (2) 1,231 1,326 (104) (281)
Total loans $ 5,287 $ 5,265 $ (27) $ (199)
Other assets
MSRs $ 1,942 $ 2,569 $ (427) $(1,465)
Certain mortgage loans held for sale 6,879 6,213 350 172
Certain equity method investments 22 47 3(17)
Total other assets $ 8,843 $ 8,829 $ (74) $(1,310)
Total assets $192,368 $171,661 $ 278 $(3,189)
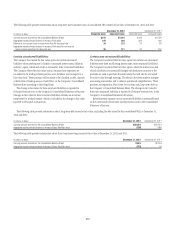
Liabilities
Interest-bearing deposits $ 1,447 $ 1,326 $ (218) $ 107
Federal funds purchased and securities loaned or sold under agreements to repurchase
Selected portfolios of securities sold under agreements to repurchase and securities loaned (1) 116,689 97,712 66 (108)
Trading account liabilities 1,461 1,763 (143) 872
Short-term borrowings 818 1,354 (2) (15)
Long-term debt 29,764 24,172 (2,225) 1,611
Total liabilities $150,179 $126,327 $(2,522) $ 2,467
(1) Reflects netting of the amounts due from securities purchased under agreements to resell and the amounts owed under securities sold under agreements to repurchase.
(2) Includes mortgage loans held by mortgage loan securitization VIEs consolidated upon the adoption of SFAS 167 on January 1, 2010.