Citibank 2012 Annual Report Download - page 125
Download and view the complete annual report
Please find page 125 of the 2012 Citibank annual report below. You can navigate through the pages in the report by either clicking on the pages listed below, or by using the keyword search tool below to find specific information within the annual report.-
 1
1 -
2
-
3
-
4
-
5
-
6
-
7
-
8
-
9
-
10
-
11
-
12
-
13
-
14
-
15
-
16
-
17
-
18
-
19
-
20
-
21
-
22
-
23
-
24
-
25
-
26
-
27
-
28
-
29
-
30
-
31
-
32
-
33
-
34
-
35
-
36
-
37
-
38
-
39
-
40
-
41
-
42
-
43
-
44
-
45
-
46
-
47
-
48
-
49
-
50
-
51
-
52
-
53
-
54
-
55
-
56
-
57
-
58
-
59
-
60
-
61
-
62
-
63
-
64
-
65
-
66
-
67
-
68
-
69
-
70
-
71
-
72
-
73
-
74
-
75
-
76
-
77
-
78
-
79
-
80
-
81
-
82
-
83
-
84
-
85
-
86
-
87
-
88
-
89
-
90
-
91
-
92
-
93
-
94
-
95
-
96
-
97
-
98
-
99
-
100
-
101
-
102
-
103
-
104
-
105
-
106
-
107
-
108
-
109
-
110
-
111
-
112
-
113
-
114
-
 115
115 -
 116
116 -
 117
117 -
 118
118 -
 119
119 -
 120
120 -
 121
121 -
 122
122 -
 123
123 -
 124
124 -
 125
125 -
 126
126 -
 127
127 -
 128
128 -
 129
129 -
 130
130 -
 131
131 -
 132
132 -
 133
133 -
 134
134 -
 135
135 -
136
-
137
-
138
-
139
-
140
-
141
-
142
-
143
-
144
-
145
-
146
-
147
-
148
-
149
-
150
-
151
-
152
-
153
-
154
-
155
-
156
-
157
-
158
-
159
-
160
-
161
-
162
-
163
-
164
-
165
-
166
-
167
-
168
-
169
-
170
-
171
-
172
-
173
-
174
-
175
-
176
-
177
-
178
-
179
-
180
-
181
-
182
-
183
-
184
-
185
-
186
-
187
-
188
-
189
-
190
-
191
-
192
-
193
-
194
-
195
-
196
-
197
-
198
-
199
-
200
-
201
-
202
-
203
-
204
-
205
-
206
-
207
-
208
-
209
-
210
-
211
-
212
-
213
-
214
-
215
-
216
-
217
-
218
-
219
-
220
-
221
-
222
-
223
-
224
-
225
-
226
-
227
-
228
-
229
-
230
-
231
-
232
-
233
-
234
-
235
-
236
-
237
-
238
-
239
-
240
-
241
-
242
-
243
-
244
-
245
-
246
-
247
-
248
-
249
-
250
-
251
-
252
-
253
-
254
-
255
-
256
-
257
-
258
-
259
-
260
-
261
-
262
-
263
-
264
-
265
-
266
-
267
-
268
-
269
-
270
-
271
-
272
-
273
-
274
-
275
-
276
-
277
-
278
-
279
-
280
-
281
-
282
-
283
-
284
-
285
-
286
-
287
-
288
-
289
-
290
-
291
-
292
-
293
-
294
-
295
-
296
-
297
-
298
-
299
-
300
-
301
-
302
-
303
-
304
-
305
-
306
-
307
-
308
-
309
-
310
-
311
-
312
-
313
-
314
-
315
-
316
-
317
-
318
-
319
-
320
-
321
-
322
-
323
-
324
 |
 |

103
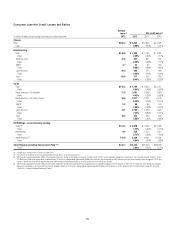
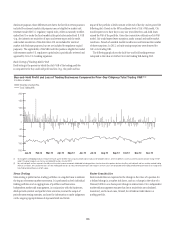
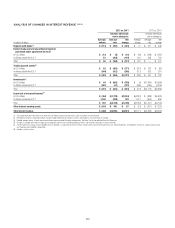
Non-Trading Portfolios—Interest Rate Exposure
The exposures in the following table represent the approximate annualized
risk to NIR assuming an unanticipated parallel instantaneous 100 bps
change in interest rates compared with the market forward interest rates in
selected currencies.
December 31, 2012 December 31, 2011
In millions of dollars Increase Decrease Increase Decrease
U.S. dollar (1) $ 842 NM $ 97 NM
Mexican peso $ 29 $ (29) $ 87 $ (87)
Euro $ 12 NM $ 69 NM
Japanese yen $ 65 NM $ 105 NM
Pound sterling $ 45 NM $ 35 NM
(1) Certain trading-oriented businesses within Citi have accrual-accounted positions that are excluded
from the table. The U.S. dollar IRE associated with these businesses was $(107) million for a
100 bps instantaneous increase in interest rates as of December 31, 2012 and $61 million as of
December 31, 2011.
NM Not meaningful. A 100 bps decrease in interest rates would imply negative rates for the yield curve.
The changes in the U.S. dollar IRE year-over-year reflected changes
in Citi’s balance sheet composition, including deposit growth. They
also reflected regular updates of behavioral assumptions for customer-
related assets and liabilities, the impact of lower rates, swap activities and
repositioning of the liquidity portfolio, including increased AFS investments
and decreasing long-term debt (see “Capital Resources and Liquidity—
Funding and Liquidity” above).
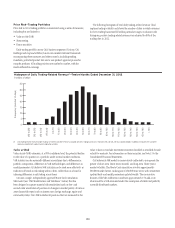
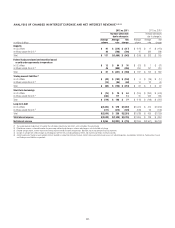
The following table shows the approximate annualized risk to NIR from
six different changes in the implied-forward rates for the U.S. dollar. Each
scenario assumes that the rate change will occur simultaneously.
Scenario 1 Scenario 2 Scenario 3 Scenario 4 Scenario 5 Scenario 6
Overnight rate change (bps) — 100 200 (200) (100) —
10-year rate change (bps) (100) — 100 (100) — 100
Impact to net interest revenue increase (decrease) (in millions of dollars) (166) 823 1,592 NM NM 163