Citibank 2012 Annual Report Download - page 52
Download and view the complete annual report
Please find page 52 of the 2012 Citibank annual report below. You can navigate through the pages in the report by either clicking on the pages listed below, or by using the keyword search tool below to find specific information within the annual report.-
 1
1 -
2
-
3
-
4
-
5
-
6
-
7
-
8
-
9
-
10
-
11
-
12
-
13
-
14
-
15
-
16
-
17
-
18
-
19
-
20
-
21
-
22
-
23
-
24
-
25
-
26
-
27
-
28
-
29
-
30
-
31
-
32
-
33
-
34
-
35
-
36
-
37
-
38
-
39
-
40
-
41
-
 42
42 -
 43
43 -
 44
44 -
 45
45 -
 46
46 -
 47
47 -
 48
48 -
 49
49 -
 50
50 -
 51
51 -
 52
52 -
 53
53 -
 54
54 -
 55
55 -
 56
56 -
 57
57 -
 58
58 -
 59
59 -
 60
60 -
 61
61 -
 62
62 -
63
-
64
-
65
-
66
-
67
-
68
-
69
-
70
-
71
-
72
-
73
-
74
-
75
-
76
-
77
-
78
-
79
-
80
-
81
-
82
-
83
-
84
-
85
-
86
-
87
-
88
-
89
-
90
-
91
-
92
-
93
-
94
-
95
-
96
-
97
-
98
-
99
-
100
-
101
-
102
-
103
-
104
-
105
-
106
-
107
-
108
-
109
-
110
-
111
-
112
-
113
-
114
-
115
-
116
-
117
-
118
-
119
-
120
-
121
-
122
-
123
-
124
-
125
-
126
-
127
-
128
-
129
-
130
-
131
-
132
-
133
-
134
-
135
-
136
-
137
-
138
-
139
-
140
-
141
-
142
-
143
-
144
-
145
-
146
-
147
-
148
-
149
-
150
-
151
-
152
-
153
-
154
-
155
-
156
-
157
-
158
-
159
-
160
-
161
-
162
-
163
-
164
-
165
-
166
-
167
-
168
-
169
-
170
-
171
-
172
-
173
-
174
-
175
-
176
-
177
-
178
-
179
-
180
-
181
-
182
-
183
-
184
-
185
-
186
-
187
-
188
-
189
-
190
-
191
-
192
-
193
-
194
-
195
-
196
-
197
-
198
-
199
-
200
-
201
-
202
-
203
-
204
-
205
-
206
-
207
-
208
-
209
-
210
-
211
-
212
-
213
-
214
-
215
-
216
-
217
-
218
-
219
-
220
-
221
-
222
-
223
-
224
-
225
-
226
-
227
-
228
-
229
-
230
-
231
-
232
-
233
-
234
-
235
-
236
-
237
-
238
-
239
-
240
-
241
-
242
-
243
-
244
-
245
-
246
-
247
-
248
-
249
-
250
-
251
-
252
-
253
-
254
-
255
-
256
-
257
-
258
-
259
-
260
-
261
-
262
-
263
-
264
-
265
-
266
-
267
-
268
-
269
-
270
-
271
-
272
-
273
-
274
-
275
-
276
-
277
-
278
-
279
-
280
-
281
-
282
-
283
-
284
-
285
-
286
-
287
-
288
-
289
-
290
-
291
-
292
-
293
-
294
-
295
-
296
-
297
-
298
-
299
-
300
-
301
-
302
-
303
-
304
-
305
-
306
-
307
-
308
-
309
-
310
-
311
-
312
-
313
-
314
-
315
-
316
-
317
-
318
-
319
-
320
-
321
-
322
-
323
-
324
 |
 |

30
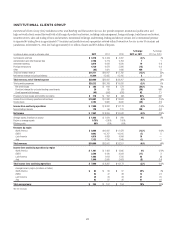
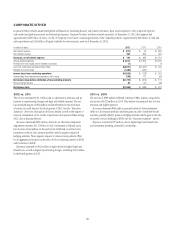
CORPORATE/OTHER
Corporate/Other includes unallocated global staff functions (including finance, risk, human resources, legal and compliance), other corporate expenses
and unallocated global operations and technology expenses, Corporate Treasury and discontinued operations. At December 31, 2012, this segment had
approximately $249 billion of assets, or 13%, of Citigroup’s total assets, consisting primarily of Citi’s liquidity portfolio (approximately $46 billion of cash and
cash equivalents and $145 billion of liquid available-for-sale securities, each as of December 31, 2012).
In millions of dollars 2012 2011 2010
Net interest revenue $ (271) $ 26 $ 828
Non-interest revenue 463 859 926
Revenues, net of interest expense $ 192 $ 885 $1,754
Total operating expenses $ 3,214 $ 2,293 $1,506
Provisions for loan losses and for benefits and claims (1) 1 (1)
Loss from continuing operations before taxes $(3,021) $(1,409) $ 249
Benefits for income taxes (1,396) (681) 7
Income (loss) from continuing operations $(1,625) $ (728) $ 242
Income (loss) from discontinued operations, net of taxes (149) 112 (68)
Net income (loss) before attribution of noncontrolling interests $(1,774) $ (616) $ 174
Noncontrolling interests 85 (27) (48)
Net income (loss) $(1,859) $ (589) $ 222
2012 vs. 2011
The net loss increased by $1.3 billion due to a decrease in revenues and an
increase in repositioning charges and legal and related expenses. The net
loss increased despite a $582 million tax benefit related to the resolution
of certain tax audit items in the third quarter of 2012 (see the “Executive
Summary” above for a discussion of this tax benefit as well as the impact of
minority investments on the results of operations of Corporate/Other during
2012, also as discussed below).
Revenues decreased $693 million, driven by an other-than-temporary
impairment of pretax $(1.2) billion on Citi’s investment in Akbank and a
loss of pretax $424 million on the partial sale of Akbank, as well as lower
investment yields on Citi’s treasury portfolio and the negative impact of
hedging activities. These negative impacts to revenues were partially offset
by an aggregate pretax gain on the sales of Citi’s remaining interest in HDFC
and its interest in SPDB.
Expenses increased by $921 million, largely driven by higher legal and
related costs, as well as higher repositioning charges, including $253 million
in the fourth quarter of 2012.
2011 vs. 2010
The net loss of $589 million reflected a decline of $811 million compared to
net income of $222 million in 2010. This decline was primarily due to lower
revenues and higher expenses.
Revenues decreased $869 million, primarily driven by lower investment
yields on Citi’s treasury portfolio and lower gains on sales of available-for-sale
securities, partially offset by gains on hedging activities and the gain on the sale
of a portion of Citi’s holdings in HDFC (see the “Executive Summary” above).
Expenses increased $787 million, due to higher legal and related costs
and investment spending, primarily in technology.