Citibank 2012 Annual Report Download - page 127
Download and view the complete annual report
Please find page 127 of the 2012 Citibank annual report below. You can navigate through the pages in the report by either clicking on the pages listed below, or by using the keyword search tool below to find specific information within the annual report.-
 1
1 -
2
-
3
-
4
-
5
-
6
-
7
-
8
-
9
-
10
-
11
-
12
-
13
-
14
-
15
-
16
-
17
-
18
-
19
-
20
-
21
-
22
-
23
-
24
-
25
-
26
-
27
-
28
-
29
-
30
-
31
-
32
-
33
-
34
-
35
-
36
-
37
-
38
-
39
-
40
-
41
-
42
-
43
-
44
-
45
-
46
-
47
-
48
-
49
-
50
-
51
-
52
-
53
-
54
-
55
-
56
-
57
-
58
-
59
-
60
-
61
-
62
-
63
-
64
-
65
-
66
-
67
-
68
-
69
-
70
-
71
-
72
-
73
-
74
-
75
-
76
-
77
-
78
-
79
-
80
-
81
-
82
-
83
-
84
-
85
-
86
-
87
-
88
-
89
-
90
-
91
-
92
-
93
-
94
-
95
-
96
-
97
-
98
-
99
-
100
-
101
-
102
-
103
-
104
-
105
-
106
-
107
-
108
-
109
-
110
-
111
-
112
-
113
-
114
-
115
-
116
-
 117
117 -
 118
118 -
 119
119 -
 120
120 -
 121
121 -
 122
122 -
 123
123 -
 124
124 -
 125
125 -
 126
126 -
 127
127 -
 128
128 -
 129
129 -
 130
130 -
 131
131 -
 132
132 -
 133
133 -
 134
134 -
 135
135 -
 136
136 -
 137
137 -
138
-
139
-
140
-
141
-
142
-
143
-
144
-
145
-
146
-
147
-
148
-
149
-
150
-
151
-
152
-
153
-
154
-
155
-
156
-
157
-
158
-
159
-
160
-
161
-
162
-
163
-
164
-
165
-
166
-
167
-
168
-
169
-
170
-
171
-
172
-
173
-
174
-
175
-
176
-
177
-
178
-
179
-
180
-
181
-
182
-
183
-
184
-
185
-
186
-
187
-
188
-
189
-
190
-
191
-
192
-
193
-
194
-
195
-
196
-
197
-
198
-
199
-
200
-
201
-
202
-
203
-
204
-
205
-
206
-
207
-
208
-
209
-
210
-
211
-
212
-
213
-
214
-
215
-
216
-
217
-
218
-
219
-
220
-
221
-
222
-
223
-
224
-
225
-
226
-
227
-
228
-
229
-
230
-
231
-
232
-
233
-
234
-
235
-
236
-
237
-
238
-
239
-
240
-
241
-
242
-
243
-
244
-
245
-
246
-
247
-
248
-
249
-
250
-
251
-
252
-
253
-
254
-
255
-
256
-
257
-
258
-
259
-
260
-
261
-
262
-
263
-
264
-
265
-
266
-
267
-
268
-
269
-
270
-
271
-
272
-
273
-
274
-
275
-
276
-
277
-
278
-
279
-
280
-
281
-
282
-
283
-
284
-
285
-
286
-
287
-
288
-
289
-
290
-
291
-
292
-
293
-
294
-
295
-
296
-
297
-
298
-
299
-
300
-
301
-
302
-
303
-
304
-
305
-
306
-
307
-
308
-
309
-
310
-
311
-
312
-
313
-
314
-
315
-
316
-
317
-
318
-
319
-
320
-
321
-
322
-
323
-
324
 |
 |

105
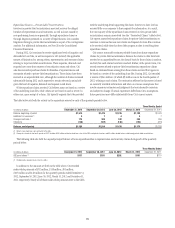
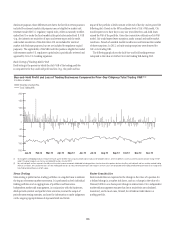
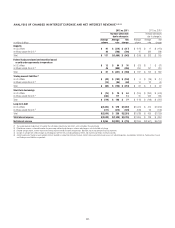
The table below summarizes VAR for Citi-wide trading portfolios at
year end and during 2012 and 2011, including yearly averages. Citi’s total
trading and credit portfolios VAR was $118 million at December 31, 2012 and
$183 million at December 31, 2011. Daily total trading and credit portfolios
VAR averaged $148 million in 2012 and ranged from $111 million to
$199 million. The change in total trading and credit portfolios VAR year-over-
year was driven by the fact that the relatively higher volatilities from 2008
and 2009 are no longer included in the three-year volatility time horizon
used for VAR, as well as reduced risk in the credit portfolios related to CVA and
Corporate Treasury.
In millions of dollars
Dec. 31,
2012
2012
Average
Dec. 31,
2011
2011
Average
Interest rate $116 $122 $147 $ 187
Foreign exchange 33 38 37 45
Equity 32 29 36 46
Commodity 11 15 16 22
Covariance adjustment (1) (76) (82) (89) (124)
Total trading VAR—
all market risk factors,
including general
and specific risk
(excluding credit portfolios) (2) $116 $122 $147 $ 176
Specific risk-only
component (3) $ 31 $ 24 $ 21 $ 25
Total trading VAR—general
market factors only
(excluding credit portfolios) (2) $ 85 $ 98 $126 $ 151
Incremental impact of
credit portfolios (4) $ 2 $ 26 $ 36 $ 13
Total trading and
credit portfolios VAR $118 $148 $183 $ 189
(1) Covariance adjustment (also known as diversification benefit) equals the difference between the
total VAR and the sum of the VARs tied to each individual risk type. The benefit reflects the fact that
the risks within each and across risk types are not perfectly correlated and, consequently, the total
VAR on a given day will be lower than the sum of the VARs relating to each individual risk type.
The determination of the primary drivers of changes to the covariance adjustment is made by an
examination of the impact of both model parameter and position changes.
(2) The total trading VAR includes trading positions from S&B, Citi Holdings and Corporate Treasury, but
excludes hedges to the loan portfolio, fair value option loans, and DVA/CVA, net of hedges. Available
for sale securities and accrual exposures are not included.
(3) The specific risk-only component represents the level of equity and fixed income issuer-specific risk
embedded in VAR.
(4) The credit portfolios are composed of mark-to-market positions associated with non-trading business
units including Corporate Treasury, the derivative counterparty CVA, net of hedges. Derivative own-
credit CVA and DVA are not included. It also includes hedges to the loan portfolio, fair value option
loans, and tail hedges that are not explicitly hedging the trading book.
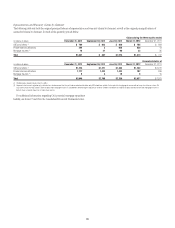
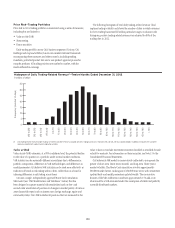
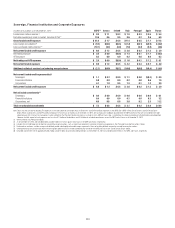
The table below provides the range of market factor VARs, inclusive of
specific risk that was experienced during 2012 and 2011.
2012 2011
In millions of dollars Low High Low High
Interest rate $ 101 $ 149 $ 138 $ 238
Foreign exchange 25 53 28 72
Equity 17 59 19 85
Commodity 9 21 14 36
The following table provides the VAR for S&B during 2012, excluding
hedges to the loan portfolio, fair value option loans and DVA/CVA, net
of hedges.
In millions of dollars Dec. 31, 2012
Total—all market risk
factors, including
general and specific risk $112
Average—during year $ 115
High—during year 145
Low—during year 92
VAR Model Review and Validation
Generally, Citi’s VAR review and model validation process entails reviewing
the model framework, major assumptions, and implementation of the
mathematical algorithm. In addition, as part of the model validation process,
product specific back-testing on hypothetical portfolios are periodically
completed and reviewed with Citi’s U.S. banking regulators. Furthermore,
back-testing is performed against the actual change in market value of
transactions on a quarterly basis at multiple levels of the organization
(trading desk level, ICG business segment and Citigroup), and the results are
also shared with the U.S. banking regulators.
Significant VAR model and assumption changes must be independently
validated within Citi’s risk management organization. This validation process
includes a review by Citi’s model validation group and further approval
from its model validation review committee, which is composed of senior
quantitative risk management officers. In the event of significant model
changes, parallel model runs are undertaken prior to implementation. In
addition, significant model and assumption changes are subject to periodic
reviews and approval by Citi’s U.S. banking regulators.
Citi uses the same independently validated VAR model for both regulatory
capital and external market risk disclosure purposes and, as such, the model
review and oversight process for both purposes is as described above. While
the scope of positions included in the VAR model calculations for regulatory
capital purposes differs from the scope of positions for external market risk