Citibank 2012 Annual Report Download - page 237
Download and view the complete annual report
Please find page 237 of the 2012 Citibank annual report below. You can navigate through the pages in the report by either clicking on the pages listed below, or by using the keyword search tool below to find specific information within the annual report.-
 1
1 -
2
-
3
-
4
-
5
-
6
-
7
-
8
-
9
-
10
-
11
-
12
-
13
-
14
-
15
-
16
-
17
-
18
-
19
-
20
-
21
-
22
-
23
-
24
-
25
-
26
-
27
-
28
-
29
-
30
-
31
-
32
-
33
-
34
-
35
-
36
-
37
-
38
-
39
-
40
-
41
-
42
-
43
-
44
-
45
-
46
-
47
-
48
-
49
-
50
-
51
-
52
-
53
-
54
-
55
-
56
-
57
-
58
-
59
-
60
-
61
-
62
-
63
-
64
-
65
-
66
-
67
-
68
-
69
-
70
-
71
-
72
-
73
-
74
-
75
-
76
-
77
-
78
-
79
-
80
-
81
-
82
-
83
-
84
-
85
-
86
-
87
-
88
-
89
-
90
-
91
-
92
-
93
-
94
-
95
-
96
-
97
-
98
-
99
-
100
-
101
-
102
-
103
-
104
-
105
-
106
-
107
-
108
-
109
-
110
-
111
-
112
-
113
-
114
-
115
-
116
-
117
-
118
-
119
-
120
-
121
-
122
-
123
-
124
-
125
-
126
-
127
-
128
-
129
-
130
-
131
-
132
-
133
-
134
-
135
-
136
-
137
-
138
-
139
-
140
-
141
-
142
-
143
-
144
-
145
-
146
-
147
-
148
-
149
-
150
-
151
-
152
-
153
-
154
-
155
-
156
-
157
-
158
-
159
-
160
-
161
-
162
-
163
-
164
-
165
-
166
-
167
-
168
-
169
-
170
-
171
-
172
-
173
-
174
-
175
-
176
-
177
-
178
-
179
-
180
-
181
-
182
-
183
-
184
-
185
-
186
-
187
-
188
-
189
-
190
-
191
-
192
-
193
-
194
-
195
-
196
-
197
-
198
-
199
-
200
-
201
-
202
-
203
-
204
-
205
-
206
-
207
-
208
-
209
-
210
-
211
-
212
-
213
-
214
-
215
-
216
-
217
-
218
-
219
-
220
-
221
-
222
-
223
-
224
-
225
-
226
-
 227
227 -
 228
228 -
 229
229 -
 230
230 -
 231
231 -
 232
232 -
 233
233 -
 234
234 -
 235
235 -
 236
236 -
 237
237 -
 238
238 -
 239
239 -
 240
240 -
 241
241 -
 242
242 -
 243
243 -
 244
244 -
 245
245 -
 246
246 -
 247
247 -
248
-
249
-
250
-
251
-
252
-
253
-
254
-
255
-
256
-
257
-
258
-
259
-
260
-
261
-
262
-
263
-
264
-
265
-
266
-
267
-
268
-
269
-
270
-
271
-
272
-
273
-
274
-
275
-
276
-
277
-
278
-
279
-
280
-
281
-
282
-
283
-
284
-
285
-
286
-
287
-
288
-
289
-
290
-
291
-
292
-
293
-
294
-
295
-
296
-
297
-
298
-
299
-
300
-
301
-
302
-
303
-
304
-
305
-
306
-
307
-
308
-
309
-
310
-
311
-
312
-
313
-
314
-
315
-
316
-
317
-
318
-
319
-
320
-
321
-
322
-
323
-
324
 |
 |

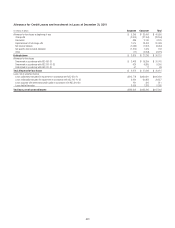
215
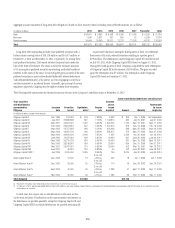
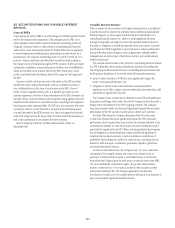
The following table shows reporting units with goodwill balances as of
December 31, 2012 and the excess of fair value as a percentage over allocated
book value as of the annual impairment test.
In millions of dollars
Reporting unit (1)
Fair value as a % of
allocated book value Goodwill
North America Regional Consumer Banking 225% $6,803
EMEA Regional Consumer Banking 150% $ 366
Asia Regional Consumer Banking 281% $ 5,489
Latin America Regional Consumer Banking 186% $1,881
Securities and Banking 137% $9,378
Transaction Services 1,336% (2) $1,603
Brokerage and Asset Management 121% $ 42
Local Consumer Lending—Cards 110% $ 111
(1) Local Consumer Lending—Other is excluded from the table as there is no goodwill allocated to it.
(2) Transaction Services: 2011 fair value has been carried forward for this reporting unit for purposes of
the 2012 annual impairment test as discussed above.
Citigroup engaged an independent valuation specialist in 2011 and
2012 to assist in Citi’s valuation for most of the reporting units employing
both the market approach and the discounted cash flow (DCF) method. Citi
believes that the DCF method, using management projections for the selected
reporting units and an appropriate risk-adjusted discount rate, is the most
reflective of a market participant’s view of fair values given current market
conditions. For the reporting units where both methods were utilized in 2011
and 2012, the resulting fair values were relatively consistent and appropriate
weighting was given to outputs from both methods.
While no impairment was noted in step one of the Local Consumer
Lending—Cards reporting unit impairment test as of July 1, 2012, goodwill
present in the reporting unit may be particularly sensitive to further
deterioration in economic conditions.
Under the market approach for valuing this reporting unit, the key
assumption is the price multiple. The selection of the multiple considers
operating performance and financial condition such as return on equity and
net income growth of Local Consumer Lending—Cards as compared to
those of selected guideline companies. Among other factors, the level and
expected growth in return on tangible equity relative to those of the guideline
companies is considered. Since the guideline company prices used are on a
minority interest basis, the selection of the multiple considers the guideline
acquisition prices which reflect control rights and privileges in arriving at a
multiple that reflects an appropriate control premium.
For the Local Consumer Lending—Cards valuation under the income
approach, the assumptions used as the basis for the model include cash flows
for the forecasted period, assumptions embedded in arriving at an estimation
of the terminal year value and discount rate. The cash flows are estimated
based on management’s most recent projections available as of the testing
date, giving consideration to target equity capital requirements based on
selected guideline companies for the reporting unit. In arriving at a terminal
value for Local Consumer Lending—Cards, using 2015 as the terminal
year, the assumptions used included a long-term growth rate. The discount
rate used in the analysis is based on the reporting units’ estimated cost of
equity capital computed under the capital asset pricing model.
If the future were to differ adversely from management’s best estimate of
key economic assumptions and associated cash flows were to decrease by a
small margin, the Company could potentially experience future impairment
charges with respect to the $111 million goodwill remaining in its Local
Consumer Lending—Cards reporting unit. Any such charge, by itself,
would not negatively affect the Company’s regulatory capital ratios, tangible
common equity or liquidity position.