Citibank 2012 Annual Report Download - page 77
Download and view the complete annual report
Please find page 77 of the 2012 Citibank annual report below. You can navigate through the pages in the report by either clicking on the pages listed below, or by using the keyword search tool below to find specific information within the annual report.-
 1
1 -
2
-
3
-
4
-
5
-
6
-
7
-
8
-
9
-
10
-
11
-
12
-
13
-
14
-
15
-
16
-
17
-
18
-
19
-
20
-
21
-
22
-
23
-
24
-
25
-
26
-
27
-
28
-
29
-
30
-
31
-
32
-
33
-
34
-
35
-
36
-
37
-
38
-
39
-
40
-
41
-
42
-
43
-
44
-
45
-
46
-
47
-
48
-
49
-
50
-
51
-
52
-
53
-
54
-
55
-
56
-
57
-
58
-
59
-
60
-
61
-
62
-
63
-
64
-
65
-
66
-
 67
67 -
 68
68 -
 69
69 -
 70
70 -
 71
71 -
 72
72 -
 73
73 -
 74
74 -
 75
75 -
 76
76 -
 77
77 -
 78
78 -
 79
79 -
 80
80 -
 81
81 -
 82
82 -
 83
83 -
 84
84 -
 85
85 -
 86
86 -
 87
87 -
88
-
89
-
90
-
91
-
92
-
93
-
94
-
95
-
96
-
97
-
98
-
99
-
100
-
101
-
102
-
103
-
104
-
105
-
106
-
107
-
108
-
109
-
110
-
111
-
112
-
113
-
114
-
115
-
116
-
117
-
118
-
119
-
120
-
121
-
122
-
123
-
124
-
125
-
126
-
127
-
128
-
129
-
130
-
131
-
132
-
133
-
134
-
135
-
136
-
137
-
138
-
139
-
140
-
141
-
142
-
143
-
144
-
145
-
146
-
147
-
148
-
149
-
150
-
151
-
152
-
153
-
154
-
155
-
156
-
157
-
158
-
159
-
160
-
161
-
162
-
163
-
164
-
165
-
166
-
167
-
168
-
169
-
170
-
171
-
172
-
173
-
174
-
175
-
176
-
177
-
178
-
179
-
180
-
181
-
182
-
183
-
184
-
185
-
186
-
187
-
188
-
189
-
190
-
191
-
192
-
193
-
194
-
195
-
196
-
197
-
198
-
199
-
200
-
201
-
202
-
203
-
204
-
205
-
206
-
207
-
208
-
209
-
210
-
211
-
212
-
213
-
214
-
215
-
216
-
217
-
218
-
219
-
220
-
221
-
222
-
223
-
224
-
225
-
226
-
227
-
228
-
229
-
230
-
231
-
232
-
233
-
234
-
235
-
236
-
237
-
238
-
239
-
240
-
241
-
242
-
243
-
244
-
245
-
246
-
247
-
248
-
249
-
250
-
251
-
252
-
253
-
254
-
255
-
256
-
257
-
258
-
259
-
260
-
261
-
262
-
263
-
264
-
265
-
266
-
267
-
268
-
269
-
270
-
271
-
272
-
273
-
274
-
275
-
276
-
277
-
278
-
279
-
280
-
281
-
282
-
283
-
284
-
285
-
286
-
287
-
288
-
289
-
290
-
291
-
292
-
293
-
294
-
295
-
296
-
297
-
298
-
299
-
300
-
301
-
302
-
303
-
304
-
305
-
306
-
307
-
308
-
309
-
310
-
311
-
312
-
313
-
314
-
315
-
316
-
317
-
318
-
319
-
320
-
321
-
322
-
323
-
324
 |
 |

55
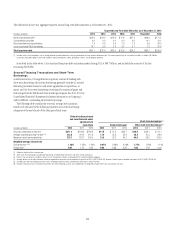
Secured Financing
Secured financing is primarily conducted through Citi’s broker-dealer
subsidiaries to facilitate customer matched-book activity and to efficiently
fund a portion of the trading inventory. As of December 31, 2012,
approximately 36% of the funding for Citi’s non-bank entities, primarily the
broker-dealer, was from secured financings.
Secured financing was $211 billion as of December 31, 2012, compared to
$198 billion as of December 31, 2011. Average balances for secured financing
were approximately $224 billion for the year ended December 31, 2012,
compared to $220 billion for the year ended December 31, 2011. Changes in
levels of secured financing were primarily due to fluctuations in inventory
for all periods discussed above (either on an end-of-quarter or on an
average basis).
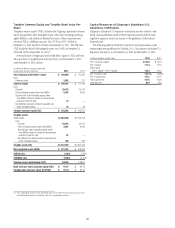
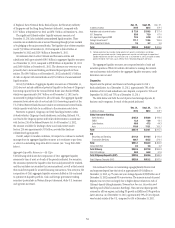
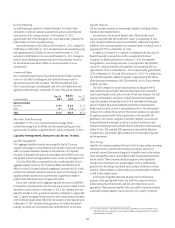
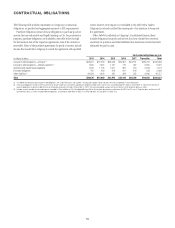
Commercial Paper
Citi’s commercial paper balances have decreased and will likely continue
to do so as Citi shifts its funding mix away from short-term sources to
deposits and long-term debt and equity. The following table sets forth
Citi’s commercial paper outstanding for each of its non-bank entities and
significant Citibank entities, respectively, for each of the periods indicated:
In billions of dollars
Dec. 31,
2012
Sep. 30,
2012
Dec. 31,
2011
Commercial paper
Non-bank $ 0.4 $ 0.6 $ 6.4
Bank 11.1 11.8 14.9
Total $11.5 $12.4 $21.3
Other Short-Term Borrowings
At December 31, 2012, Citi’s other short-term borrowings, which
includes borrowings from the FHLBs and other market participants, were
approximately $41 billion, compared with $33 billion at December 31, 2011.
Liquidity Management, Measures and Stress Testing
Liquidity Management
Citi’s aggregate liquidity resources are managed by the Citi Treasurer.
Liquidity is managed via a centralized treasury model by Corporate Treasury
and by in-country treasurers. Pursuant to this structure, Citi’s liquidity
resources are managed with a goal of ensuring the asset/liability match and
that liquidity positions are appropriate in every country and throughout Citi.
Citi’s Chief Risk Officer is responsible for the overall risk profile of Citi’s
aggregate liquidity resources. The Chief Risk Officer and Chief Financial
Officer co-chair Citi’s Asset Liability Management Committee (ALCO), which
includes Citi’s Treasurer and senior executives. ALCO sets the strategy of the
liquidity portfolio and monitors its performance. Significant changes to
portfolio asset allocations need to be approved by ALCO.
Excess cash available in Citi’s aggregate liquidity resources is available to
be invested in a liquid portfolio such that cash can be made available to meet
demand in a stress situation. At December 31, 2012, Citi’s liquidity pool was
primarily invested in cash, government securities, including U.S. agency debt
and U.S. agency mortgage-backed securities, and a certain amount of highly
rated investment-grade credits. While the vast majority of Citi’s liquidity pool
at December 31, 2012 consisted of long positions, Citi utilizes derivatives to
manage its interest rate and currency risks; credit derivatives are not used. 13 Citi’s estimated LCR is a non-GAAP financial measure. Citi believes this measure provides useful
information to investors and others by measuring Citi’s progress toward potential future expected
regulatory liquidity standards.
Liquidity Measures
Citi uses multiple measures in monitoring its liquidity, including without
limitation those described below.
In broad terms, the structural liquidity ratio, defined as the sum of
deposits, long-term debt and stockholders’ equity as a percentage of total
assets, measures whether the asset base is funded by sufficiently long-dated
liabilities. Citi’s structural liquidity ratio remained stable over the past year at
approximately 73% as of December 31, 2012.
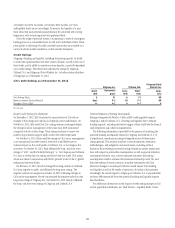
In addition, Citi believes it is currently in compliance with the proposed
Basel III Liquidity Coverage Ratio (LCR), as amended by the Basel
Committee on Banking Supervision on January 7, 2013 (the amended
LCR guidelines), even though such ratio is not proposed to take full effect
until 2019. Using the amended LCR guidelines, Citi’s estimated LCR was
approximately 122% as of December 31, 2012, compared with approximately
127% at September 30, 2012 and 143% at March 31, 2012.13 On a dollar basis,
the 122% LCR represents additional liquidity of approximately $65 billion
above the proposed minimum 100% LCR threshold. Citi’s LCR may decrease
modestly over time.
The LCR is designed to ensure banks maintain an adequate level of
unencumbered cash and highly liquid securities that can be converted to
cash to meet liquidity needs under an acute 30-day stress scenario. The LCR
estimate is calculated in accordance with the amended LCR guidelines.
Under the amended LCR guidelines, the LCR is calculated by dividing the
amount of highly liquid unencumbered government and government-
backed cash securities, as well as unencumbered cash, by the estimated net
outflows over a stressed 30-day period. The net cash outflows are calculated
by applying assumed outflow factors, prescribed in the amended LCR
guidelines, to the various categories of liabilities (deposits, unsecured and
secured wholesale borrowings), as well as to unused commitments and
derivatives-related exposures, partially offset by inflows from assets maturing
within 30 days. The amended LCR requirements expanded the definition
of liquid assets, and reduced outflow estimates for certain types of deposits
and commitments.
Stress Testing
Liquidity stress testing is performed for each of Citi’s major entities, operating
subsidiaries and/or countries. Stress testing and scenario analyses are
intended to quantify the potential impact of a liquidity event on the balance
sheet and liquidity position, and to identify viable funding alternatives that
can be utilized. These scenarios include assumptions about significant
changes in key funding sources, market triggers (such as credit ratings),
potential uses of funding and political and economic conditions in certain
countries. These conditions include standard and stressed market conditions
as well as firm-specific events.
A wide range of liquidity stress tests are important for monitoring
purposes. Some span liquidity events over a full year, some may cover an
intense stress period of one month, and still other time frames may be
appropriate. These potential liquidity events are useful to ascertain potential
mismatches between liquidity sources and uses over a variety of horizons