Citibank 2012 Annual Report Download - page 180
Download and view the complete annual report
Please find page 180 of the 2012 Citibank annual report below. You can navigate through the pages in the report by either clicking on the pages listed below, or by using the keyword search tool below to find specific information within the annual report.-
 1
1 -
2
-
3
-
4
-
5
-
6
-
7
-
8
-
9
-
10
-
11
-
12
-
13
-
14
-
15
-
16
-
17
-
18
-
19
-
20
-
21
-
22
-
23
-
24
-
25
-
26
-
27
-
28
-
29
-
30
-
31
-
32
-
33
-
34
-
35
-
36
-
37
-
38
-
39
-
40
-
41
-
42
-
43
-
44
-
45
-
46
-
47
-
48
-
49
-
50
-
51
-
52
-
53
-
54
-
55
-
56
-
57
-
58
-
59
-
60
-
61
-
62
-
63
-
64
-
65
-
66
-
67
-
68
-
69
-
70
-
71
-
72
-
73
-
74
-
75
-
76
-
77
-
78
-
79
-
80
-
81
-
82
-
83
-
84
-
85
-
86
-
87
-
88
-
89
-
90
-
91
-
92
-
93
-
94
-
95
-
96
-
97
-
98
-
99
-
100
-
101
-
102
-
103
-
104
-
105
-
106
-
107
-
108
-
109
-
110
-
111
-
112
-
113
-
114
-
115
-
116
-
117
-
118
-
119
-
120
-
121
-
122
-
123
-
124
-
125
-
126
-
127
-
128
-
129
-
130
-
131
-
132
-
133
-
134
-
135
-
136
-
137
-
138
-
139
-
140
-
141
-
142
-
143
-
144
-
145
-
146
-
147
-
148
-
149
-
150
-
151
-
152
-
153
-
154
-
155
-
156
-
157
-
158
-
159
-
160
-
161
-
162
-
163
-
164
-
165
-
166
-
167
-
168
-
169
-
 170
170 -
 171
171 -
 172
172 -
 173
173 -
 174
174 -
 175
175 -
 176
176 -
 177
177 -
 178
178 -
 179
179 -
 180
180 -
 181
181 -
 182
182 -
 183
183 -
 184
184 -
 185
185 -
 186
186 -
 187
187 -
 188
188 -
 189
189 -
 190
190 -
191
-
192
-
193
-
194
-
195
-
196
-
197
-
198
-
199
-
200
-
201
-
202
-
203
-
204
-
205
-
206
-
207
-
208
-
209
-
210
-
211
-
212
-
213
-
214
-
215
-
216
-
217
-
218
-
219
-
220
-
221
-
222
-
223
-
224
-
225
-
226
-
227
-
228
-
229
-
230
-
231
-
232
-
233
-
234
-
235
-
236
-
237
-
238
-
239
-
240
-
241
-
242
-
243
-
244
-
245
-
246
-
247
-
248
-
249
-
250
-
251
-
252
-
253
-
254
-
255
-
256
-
257
-
258
-
259
-
260
-
261
-
262
-
263
-
264
-
265
-
266
-
267
-
268
-
269
-
270
-
271
-
272
-
273
-
274
-
275
-
276
-
277
-
278
-
279
-
280
-
281
-
282
-
283
-
284
-
285
-
286
-
287
-
288
-
289
-
290
-
291
-
292
-
293
-
294
-
295
-
296
-
297
-
298
-
299
-
300
-
301
-
302
-
303
-
304
-
305
-
306
-
307
-
308
-
309
-
310
-
311
-
312
-
313
-
314
-
315
-
316
-
317
-
318
-
319
-
320
-
321
-
322
-
323
-
324
 |
 |

158
The ASU became effective for Citigroup on January 1, 2012. The guidance
has been applied prospectively to transactions or modifications of existing
transactions occurring on or after January 1, 2012. The ASU has not had a
material effect on the Company’s financial statements. A nominal amount
of the Company’s repurchase transactions that would previously have been
accounted for as sales is now accounted for as financing transactions.
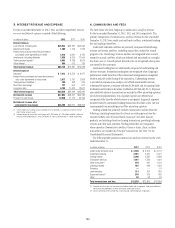
Fair Value Measurement
In May 2011, the FASB issued ASU No. 2011-04, Fair Value Measurement
(Topic 820): Amendments to Achieve Common Fair Value Measurement
and Disclosure Requirements in U.S. GAAP and IFRS. The ASU created
a common definition of fair value for U.S. GAAP and IFRS and aligned the
measurement and disclosure requirements. It required significant additional
disclosures both of a qualitative and quantitative nature, particularly for
those instruments measured at fair value that are classified in Level 3 of
the fair value hierarchy. Additionally, the ASU provided guidance on when
it is appropriate to measure fair value on a portfolio basis and expanded
the prohibition on valuation adjustments where the size of the Company’s
position is a characteristic of the adjustment from Level 1 to all levels of the
fair value hierarchy.
The ASU became effective for Citigroup on January 1, 2012. As a result of
implementing the prohibition on valuation adjustments where the size of
the Company’s position is a characteristic, the Company released reserves of
approximately $125 million, increasing pretax income in the first quarter
of 2012.
Deferred Asset Acquisition Costs
In October 2010, the FASB issued ASU No. 2010-26, Financial Services –
Insurance (Topic 944): Accounting for Costs Associated with Acquiring
or Renewing Insurance Contracts. The ASU amended the guidance for
insurance entities that required deferral and subsequent amortization of
certain costs incurred during the acquisition of new or renewed insurance
contracts, commonly referred to as deferred acquisition costs (DAC). The
new guidance limited DAC to those costs directly related to the successful
acquisition of insurance contracts; all other acquisition-related costs must be
expensed as incurred. Under prior guidance, DAC consisted of those costs that
vary with, and primarily relate to, the acquisition of insurance contracts.
The ASU became effective for Citigroup on January 1, 2012 and was
adopted using the retrospective method. As a result of implementing the ASU,
DAC was reduced by approximately $165 million and a $58 million deferred
tax asset was recorded with an offset to opening retained earnings of $107
million (net of tax).
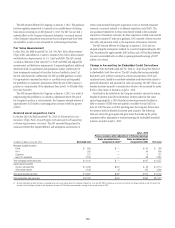
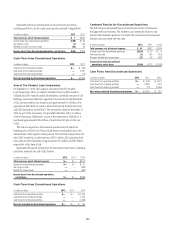
Change in Accounting for Embedded Credit Derivatives
In March 2010, the FASB issued ASU No. 2010-11, Scope Exception Related
to Embedded Credit Derivatives. The ASU clarifies that certain embedded
derivatives, such as those contained in certain securitizations, CDOs and
structured notes, should be considered embedded credit derivatives subject to
potential bifurcation and separate fair value accounting. The ASU allows any
beneficial interest issued by a securitization vehicle to be accounted for under
the fair value option at transition on July 1, 2010.
As set forth in the table below, the Company elected to account for certain
beneficial interests issued by securitization vehicles under the fair value
option beginning July 1, 2010. Beneficial interests previously classified as
held-to-maturity (HTM) were reclassified to available-for-sale (AFS) on
June 30, 2010 because, as of that reporting date, the Company did not have
the intent to hold the beneficial interests until maturity. The following
table also shows the gross gains and gross losses that make up the pretax
cumulative-effect adjustment to retained earnings for reclassified beneficial
interests, recorded on July 1, 2010:
July 1, 2010
Pretax cumulative effect adjustment to Retained earnings
In millions of dollars at June 30, 2010 Amortized cost
Gross unrealized losses
recognized in AOCI (1)
Gross unrealized gains
recognized in AOCI Fair value
Mortgage-backed securities
Prime $ 390 $ — $ 49 $ 439
Alt-A 550 — 54 604
Subprime 221 — 6 227
Non-U.S. residential 2,249 — 38 2,287
Total mortgage-backed securities $ 3,410 $ — $147 $ 3,557
Asset-backed securities
Auction rate securities $ 4,463 $401 $ 48 $ 4,110
Other asset-backed 4,189 19 164 4,334
Total asset-backed securities $ 8,652 $420 $212 $ 8,444
Total reclassified debt securities $12,062 $420 $359 $12,001
(1) All reclassified debt securities with gross unrealized losses were assessed for other-than-temporary-impairment as of June 30, 2010, including an assessment of whether the Company intends to sell the security. For
securities that the Company intends to sell, impairment charges of $176 million were recorded in earnings in the second quarter of 2010.